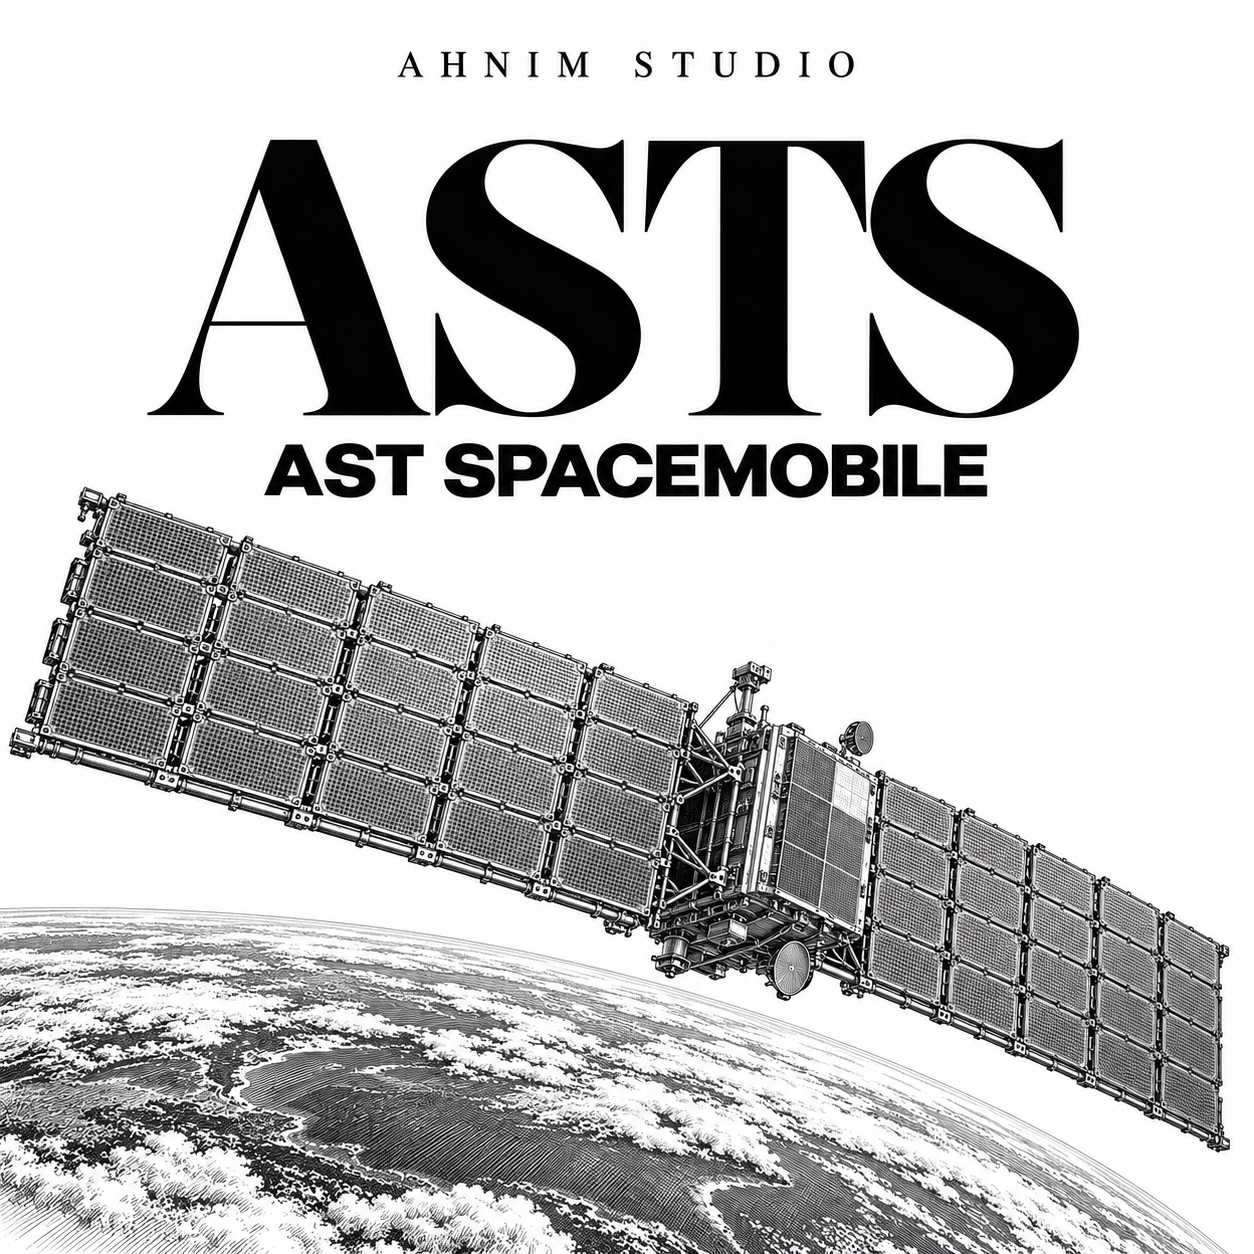
AST SpaceMobile’s (NASDAQ: ASTS) $42.3 million of third-quarter revenue is evidence that government and partner contracts are turning into recognized sales, but it does not yet prove that paid consumer satellite service is operating at scale. Product revenue carried a negative direct gross profit, nine-month operating cash flow plus capital expenditure consumed $1.47 billion, and the company ended September with $2.80 billion of unrestricted cash against $4.16 billion of debt. The quarter improves visibility; it does not remove the financing and execution tests.
Research cutoff: November 10, 2026, 8:00 a.m. ET. Market reference: ASTS closed at $36.89 on November 9. Figures are GAAP unless stated otherwise.
Three findings
- Revenue quality is mixed: $20.6 million of product revenue produced negative $1.9 million of direct product gross profit, while $21.8 million of service revenue produced $18.9 million of direct service gross profit.
- Liquidity is large but constrained: the headline $3.23 billion cash figure includes $434.6 million of restricted cash; unrestricted cash was $2.80 billion, below $4.16 billion of debt.
- The valuation debate remains wide: AHNIM’s unchanged October 2027 Base value of $55 is 31.9% below the $80.71 average of 11 analyst targets shown by Google Finance at the research cutoff.
What changed in Q3 2026
AST SpaceMobile reported revenue of $42.321 million, up from $14.739 million a year earlier. Product revenue was $20.571 million and service revenue was $21.750 million. The important distinction is that these lines do not equal nationwide recurring consumer revenue. The company’s filing and presentation point to government, equipment and partner milestones while commercial service remains in rollout.
| Q3 2026 metric | Reported result | What it means |
|---|---|---|
| Product revenue | $20.571m | Hardware and related contract recognition; not recurring subscriber revenue |
| Service revenue | $21.750m | High direct margin, but the filing does not disclose a consumer-subscriber split |
| Total revenue | $42.321m | A record quarter, still small beside deployment spending |
| Operating loss | $(168.705)m | Revenue less $211.026m of reported operating costs and expenses |
| Net loss attributable to common stockholders | $(132.380)m | $(0.44) per basic and diluted share |
Direct product costs were $22.451 million, leaving negative $1.880 million of product gross profit. Direct service costs were $2.863 million, leaving $18.887 million of service gross profit, or 86.8%. Combined product-and-service direct gross profit was $17.007 million, a 40.2% margin. That is not a full-company gross-margin calculation because AST also reported $95.788 million of engineering-service costs among operating expenses.
The company maintained full-year 2026 revenue guidance of $150 million to $200 million. Nine-month revenue was $88.575 million, so the range requires Q4 revenue of about $61.425 million to $111.425 million. This is company guidance, not an AHNIM forecast, and the final mix will matter as much as the headline amount.
The service-readiness question
Management expects intermittent nationwide service by year-end and says launch agreements cover more than 100 BlueBird satellites expected to be deployed cumulatively in 2027–2028. It also targets production capacity of six satellites per month in December. These are meaningful deployment indicators, but they are forward milestones—not evidence that constellation coverage, regulatory approvals, carrier integration, device performance and paying usage have all cleared.
The result therefore strengthens the funding and contract-conversion case while leaving the core commercial test unchanged: AST must move from equipment and milestone revenue to repeatable service revenue, with disclosed users, usage, pricing and carrier economics. The recent Rakuten-led Japan funding and the BlackLift launch agreement reduce specific execution bottlenecks, but neither is the same as commercial service completion.
Cash, debt and dilution
| Balance-sheet / cash-flow item | September 30, 2026 | AHNIM reading |
|---|---|---|
| Unrestricted cash and cash equivalents | $2.799bn | Available liquidity before future operations and deployment spending |
| Restricted cash, current and non-current | $434.569m | Included in the company’s $3.2bn headline cash figure but not freely deployable |
| Total debt | $4.161bn | Exceeds unrestricted cash by about $1.362bn |
| Nine-month operating cash flow | $(314.477)m | Cash used by operations |
| Nine-month purchases of property and equipment | $(1.154)bn | Deployment and production investment |
| Simple operating cash flow + capex use | $(1.469)bn | Not free cash flow guidance; a reproducible cash-use measure |
The company raised net proceeds of $80.3 million through its at-the-market program during the first nine months. At September 30, its economic share count—Class A shares plus the Class B and Class C units tied to economic interests—was about 390.0 million. Potential dilution excluded from diluted EPS included roughly 40.3 million shares linked to convertible notes and 13.0 million equity awards. Investors should therefore keep separate the cash raised, current voting-share count and fully diluted economic exposure.
Valuation: why our Base case stays at $55
Our AST SpaceMobile research hub preserves the October 2027 conditional values of $5 Bear, $55 Base and $123 Bull. We do not raise the Base case on this quarter alone. The Base model already assumes substantial external funding and dilution and requires roughly $4 billion of 2030 revenue. Q3’s $42.3 million confirms contract execution, but it does not yet validate that long-range commercial revenue threshold.
| Reference | Value | Difference from AHNIM Base |
|---|---|---|
| AHNIM Base (October 2027 horizon) | $55 | — |
| Google Finance analyst average (11 targets, Nov. 10 cutoff) | $80.71 | AHNIM Base is 31.9% lower |
| Nov. 9 regular-session close | $36.89 | AHNIM Base is 49.1% higher |
Google Finance listed recent maintained targets including Scotiabank at $55.70 and Cantor Fitzgerald at $90. We could not inspect the proprietary underlying reports, and we found no verified post-results target change at the cutoff. The 31.9% gap between our Base case and the displayed analyst average exceeds AHNIM’s 20% alert threshold. The gap mainly reflects our explicit dilution, funding and commercialization hurdles.
What would change the view
- Positive: disclosed paying-user and usage metrics, repeatable carrier revenue, sustained satellite output near six per month, and launches that support the year-end service claim.
- Negative: a service delay, another sharp rise in cash use, lower-than-planned launch cadence, weak product economics, or financing that increases per-share dilution faster than enterprise value.
- Model trigger: evidence that 2030 revenue probability or the fully diluted share count has moved materially from the assumptions preserved in the existing model.
Sources and original documents
- AST SpaceMobile Form 10-Q for the quarter ended September 30, 2026 (filed November 9, 2026)
- AST SpaceMobile Q3 2026 earnings release (November 9, 2026)
- AST SpaceMobile Q3 2026 business update presentation (November 9, 2026)
- Google Finance ASTS market and analyst-target reference (accessed November 10, 2026)
This article is for information and education only and is not investment advice. AHNIM STUDIO separates company statements, external opinions and its own assumptions; see our About page for editorial and correction policies.
Leave a Reply