
AHNIM STUDIO · Company research · NVTS
Updated October 11, 2026. Latest financial statements reviewed: June 30, 2026. Reference price: $10.78, October 9 regular-session close. All amounts are US dollars. Model: AHNIM-NVTS-LT-20261011-R1. [24]
Our current stance: continued coverage, but insufficient evidence for an attractive new purchase at the reference price. We will keep following Navitas, its NVIDIA 800V opportunity and Claros commercialization. Our valuation will change when evidence changes expected revenue, profitability, investment needs or dilution. For now, our scenarios do not establish an adequate margin of safety. This is a valuation judgment, not a claim that the technology will fail or a personal instruction to sell.
1. The business: power delivery around AI
Navitas follows a fabless model. It designs and markets chips while outside suppliers manufacture, assemble and test them. This reduces the need to own fabrication plants, but makes manufacturing access, product qualification and supplier execution important to the business. Its portfolio centers on gallium nitride (GaN) and silicon carbide (SiC). These materials can improve power-conversion efficiency in suitable applications; the advantage depends on the device and system design. [1]
Under its Navitas 2.0 strategy, management is shifting resources from mobile and lower-end consumer markets toward AI data centers, grid and energy infrastructure, performance computing and industrial electrification. This is a business transition that requires new customers and product qualifications. The size of those markets does not establish how much revenue Navitas will capture. [16]
| Position in the power system | Navitas technology | Commercial question |
|---|---|---|
| Facility and higher-voltage conversion | GeneSiC SiC devices | Can qualified products win profitable production orders? |
| Rack and compute-tray conversion | GaNFast GaN devices and power ICs | Can reference designs become repeat customer shipments? |
| Power delivery close to the processor | Claros integrated voltage regulators (IVRs) | Can the acquired technology reach reliable volume production? |
NVIDIA independently lists Navitas among its 800 VDC ecosystem partners. That validates its participation in the architecture, while leaving supplier share and commercial economics open. NVIDIA also lists several competing semiconductor companies. Ecosystem membership alone does not disclose a purchase commitment, exclusive supply position or recognized NVIDIA revenue. [2]
There is concrete development work to follow. On October 5, Navitas and Microchip announced an 800 VDC-to-6 VDC reference design to help customers develop systems. The next evidence we want is customer qualification, production timing, unit shipments and revenue. A working reference design is an important step in that sequence. [13]
2. Revenue recovery and the margin gap
Q2 2026 revenue was $10.529 million, up 22.5% from Q1 but down 27.3% from a year earlier. The chart shows a recovery from the late-2025 trough, with sales still below early-2025 levels. Full-year 2025 revenue had fallen to $45.916 million from $83.302 million in 2024. These comparisons keep the recent rebound in perspective. [3] [4] [5]
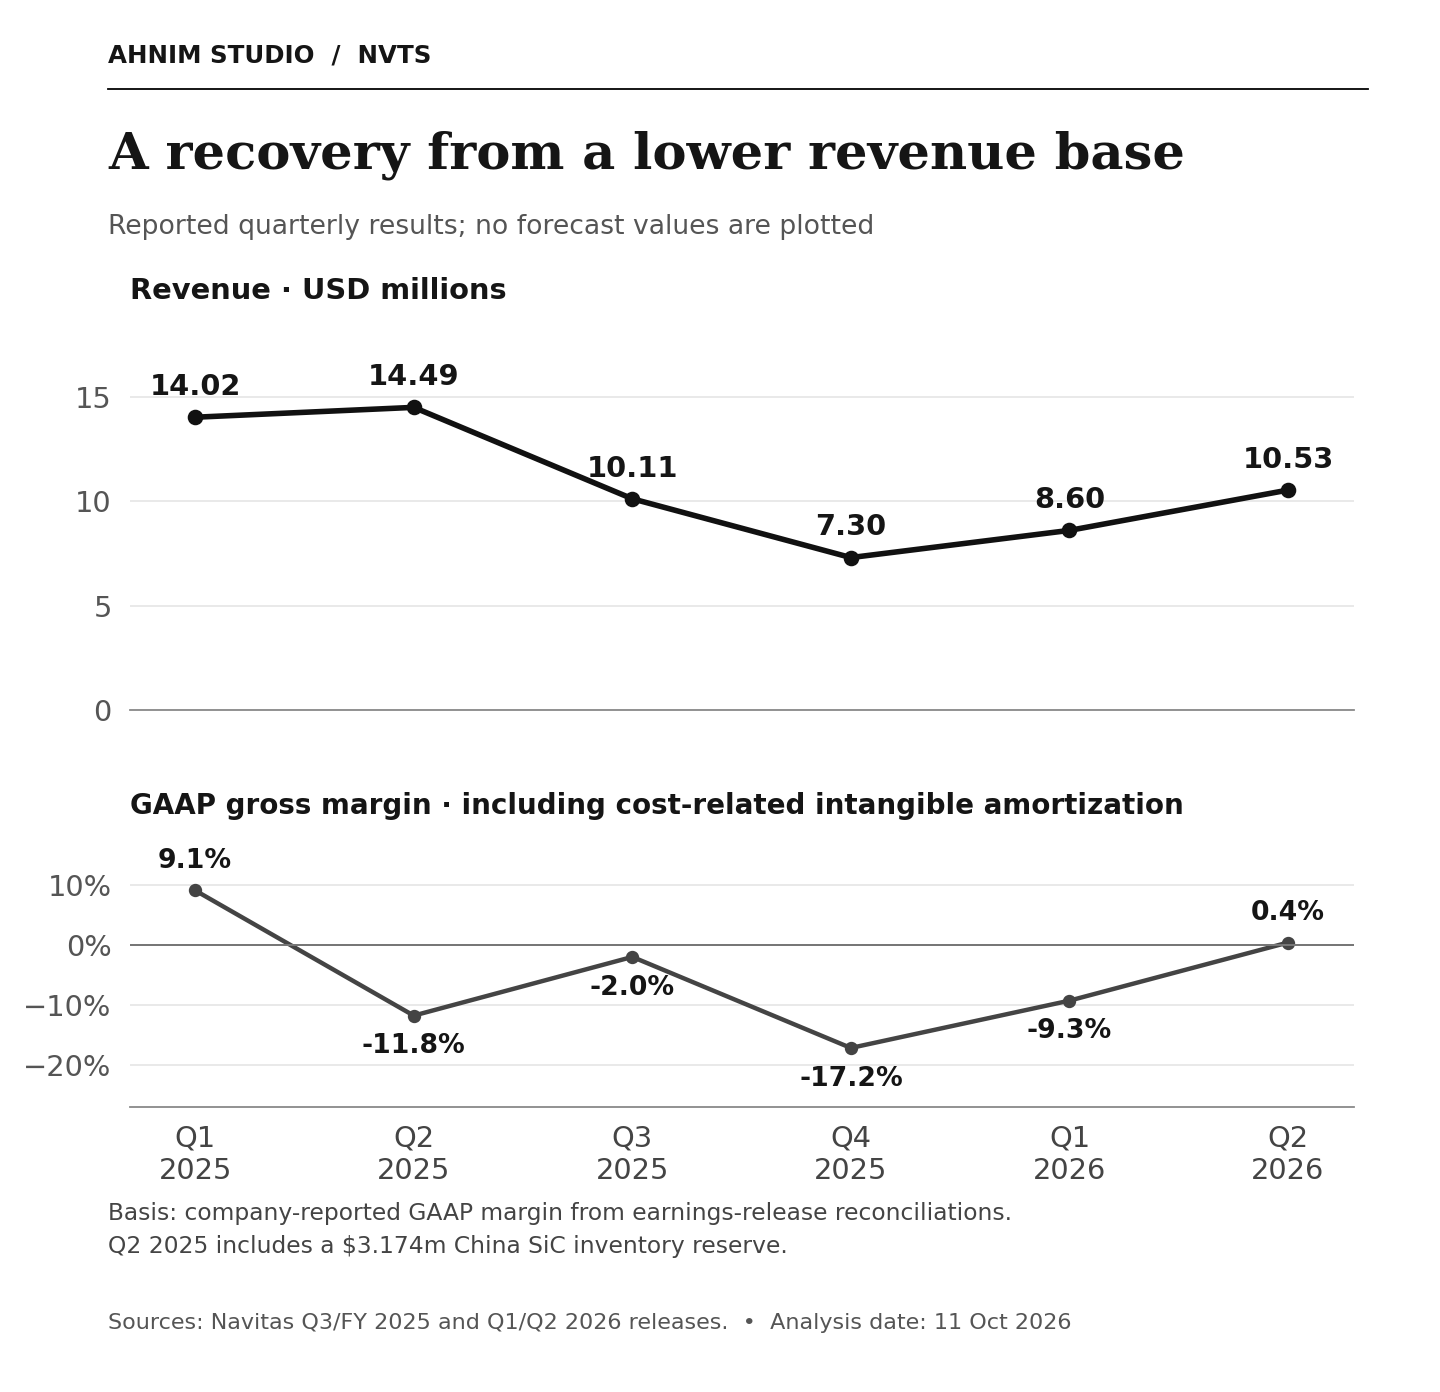
For Q2, Navitas reported 0.4% GAAP gross margin and 39.5% adjusted gross margin. Cost-related amortization of acquired intangible assets explains most of the gap. The adjusted figure helps assess product economics before specified exclusions; GAAP retains acquisition-related accounting costs. Both deserve visibility. Using the cost-of-revenue line without its separately presented amortization would overstate GAAP profitability. [3]
The low GAAP margin should not be read as an almost-zero cash margin on each product: the amortization is non-cash. Even after the company’s adjustments, however, Q2 operating loss was $11.351 million, against a GAAP operating loss of $27.190 million. Product gross profit still falls short of covering operating expenses. [3]
Illustrative operating break-even: holding Q2 adjusted operating expenses of $15.510 million and adjusted gross margin of 39.5% constant gives $15.510m ÷ 39.5% ≈ $39.3 million quarterly revenue, about 3.7 times Q2 sales. This is our static calculation, not a forecast or cash break-even estimate. It excludes incremental Claros costs, interest and GAAP adjustments; actual expenses and margins will change. [3]
In its July 27 release, management guided to Q3 revenue of $13–14 million and adjusted gross margin of 38.7–40.7%. Those are management forecasts, not Q3 reported results. Even if sales recover, the investment case needs sustained growth sufficient to support development and operating costs. [3]
3. Cash: financing strength and operating burn
First-half operating cash flow was negative $48.348 million, compared with negative $24.765 million a year earlier. Meanwhile, the company raised $373.165 million net through its at-the-market share offering. The chart reconciles the resulting cash increase: financing supplied the cash while operations consumed it. [7]

The financing provides resources to pursue the strategy. For existing owners, it also makes dilution part of the analysis. We will track whether capital raised today creates enough future cash generation to improve value per share. A larger corporate cash balance, by itself, does not answer that question.
The June 30 cash balance is historical. It precedes subsequent operating spending and the October acquisition. The June balance alone is therefore insufficient to establish current liquidity or the cash runway after Claros.
4. Claros: a wider opportunity with a real purchase cost
Navitas completed the Claros acquisition on October 6. Claros adds integrated voltage regulators that move power conversion close to the processor, where very low voltage and high current create difficult engineering problems. Management describes the technology as an incremental growth accelerator from 2028–2029 onward. That timetable makes it primarily a longer-term commercialization opportunity. [10] [11] [9]
| Announced consideration | Reference amount | Treatment |
|---|---|---|
| Cash | $126.4 million | Subject to contractual adjustments |
| Closing stock | $89.7 million; approximately 6.9 million shares | Equity consideration |
| Contingent earnout | Up to $16.7 million in stock | Subject to milestones |
| Separate employee performance awards | $28.9 million reference value | Separate from the $232.8 million purchase estimate |
The announced purchase estimate was $232.8 million including the contingent earnout. The separate employee awards represent additional potential dilution outside that purchase estimate. Our economic assessment must ultimately combine acquired revenue, margin potential, integration costs, cash paid and additional shares. The closing announcement alone does not provide that full model. Section 6 therefore uses disclosed transaction terms and clearly labeled cash-spending and dilution estimates, pending a reconciled post-acquisition financial statement. [8] [10]
Management’s expanded addressable-market estimate describes industry opportunity. It is not a company sales forecast. We would not add Claros’s potential market directly to near-term revenue assumptions or move expected 2028–2029 benefits into 2026 simply because the transaction has closed. [9]
5. Manufacturing and execution risks
The manufacturing transition matters. Navitas’s annual filing says TSMC intends to stop GaN production in July 2027. In September, Navitas announced GlobalFoundries milestones including internal samples scheduled for October and strategic-customer samples before year-end. These are useful progress markers; customer qualification, yield and reliable volume supply still require execution. [1] [12]
Legal disputes also require monitoring. The Q2 filing describes Wolfspeed’s patent lawsuit and Renesas’s trade-secret and contract claims, which Navitas disputes. Navitas subsequently announced its own patent lawsuit against Renesas. These remain allegations rather than established findings of wrongdoing. Litigation can create expense, distraction and potential restrictions regardless of the strength of the product roadmap. [7] [14]
Capital allocation extends beyond Claros. A September agreement commits Navitas to a $5 million Magnachip share investment. We include this as another disclosed commitment when assessing future liquidity, without treating the agreement as independent confirmation of a completed cash payment. [15]
6. Long-term valuation and the investment hurdle
Every forecast in this section is an AHNIM assumption, except facts explicitly attributed to filings or management. We model partial success, scaled success and a stronger leadership case, with failure discussed separately. These labels do not imply calibrated probabilities. We cannot reliably assign a numerical success probability from the public customer, volume and pricing information available.
| Scenario | December 2035 value | October 2026 equivalent |
|---|---|---|
| Partial success | $4.80 | $1.43 |
| Scaled success | $16.87 | $5.04 |
| Strong leadership | $36.35 | $10.86 |
Present equivalent = December 2035 conditional share value ÷ 1.149.221081. The 14% required return is our risk-and-opportunity-cost assumption, not an observed guaranteed return or an objectively certain discount rate. Higher required returns lower present equivalents; lower required returns raise them. These calculations help compare long-term outcomes with the dated $10.78 market reference. They do not establish a unique current fair value. [24]
| Revenue, US$m | Partial / scaled success | Strong leadership |
|---|---|---|
| 2027 | 55.9 / 81.2 | 81.2 |
| 2028 | 101.1 / 207.5 | 207.5 |
| 2029 | 241.9 / 543.0 | 543.0 |
| 2030 | 481.8 / 1,094.1 | 1,600.0 |
| 2035 | 877.1 / 2,361.9 | 3,875.0 |
Management presents Claros as an additional growth driver from 2028–2029 onward and says the acquisition leaves the existing short-to-mid-term organic model unchanged. NVIDIA’s architecture roadmap also requires a staged transition. We therefore give the opportunity time to develop rather than treating 2027 as the last year of growth. Neither a technical roadmap nor an acquisition closing establishes Navitas’s awarded share of future production. [21] [25]
A future $40 is different from a current $40 fair value. From $10.78 to $40 at the end of 2035, with no interim distribution, the annualized return is about 15.3%. The scaled-success value of $16.87 instead corresponds to approximately 5.0% annually. Long-term business growth and attractive returns from today’s purchase price are separate tests.
6.1 Revenue construction: 800V, grid and Claros
Our model separates inside-data-center 800V conversion, grid equipment, Claros processor-level power delivery, conventional AI products and other markets. Inside-data-center revenue uses annual GPU rated-power benchmark × eligibility × 800V adoption × content per kW × Navitas content capture. Management discussed approximately $15,000 of GaN and $10,000 of SiC/JFET content per MW inside the data center, with grid content separate. We use $25/kW inside the facility, $12.50/kW for the separate grid opportunity, and an assumed $50 of net Claros revenue per equipped processor. The $50 Claros figure is an AHNIM assumption, not a disclosed ASP. [22]
The 35 / 41 / 52 / 71 GW benchmarks for 2027–2030 come from an older company GPU power forecast. They are model scale inputs, not current awarded deployments, electricity consumption, or confirmed customer orders. Eligibility, adoption and capture assumptions must reduce that theoretical opportunity before estimating revenue. We do not add an older aggregate content estimate on top of Claros and count the same power stages twice. [23]
| Year | Eligibility / 800V adoption / capture | Inside 800V, $m | Grid / Claros / other, $m |
|---|---|---|---|
| 2027 | 75% / 9% / 15% | 8.859 | 0.000 / 0.000 / 47.000 |
| 2028 | 75% / 23% / 20% | 35.362 | 3.750 / 10.000 / 52.000 |
| 2029 | 75% / 50% / 25% | 121.875 | 15.000 / 50.000 / 55.000 |
| 2030 | 75% / 80% / 25% | 266.250 | 37.500 / 120.000 / 58.000 |
| Year | Eligibility / 800V adoption / capture | Inside 800V, $m | Grid / Claros / other, $m |
|---|---|---|---|
| 2027 | 100% / 15% / 20% | 26.250 | 0.000 / 0.000 / 55.000 |
| 2028 | 100% / 40% / 25% | 102.500 | 10.000 / 30.000 / 65.000 |
| 2029 | 100% / 70% / 30% | 273.000 | 45.000 / 150.000 / 75.000 |
| 2030 | 100% / 90% / 35% | 559.125 | 100.000 / 350.000 / 85.000 |
Worked example — partial success in 2029: 52 × 75% × 50% × $25 × 25% = $121.875m of inside-800V revenue. Add $15m grid, $50m Claros and $55m conventional AI/other revenue to obtain $241.875m. The GW and $/kW conversion yields millions of dollars. Claros units are modeled at 0 / 0.2 / 1 / 2.4 million in partial success and 0 / 0.6 / 3 / 7 million in scaled success across 2027–2030; each uses the assumed $50 net content. Separate grid revenue is an additional assumption about deployment and captured content, not an automatic entitlement.
6.2 Cash, dilution and the per-share bridge
We begin with an estimated end-2026 cash balance of $386.009m: June reported cash $557.409m − contractual Claros cash estimate $126.4m − assumed Magnachip investment payment $5m − H2 cash-use budget $40m. This is not a reported current cash balance. The $40m includes approximately $5m for unpaid closing/integration costs or adjustments; we do not charge that allowance twice. Final purchase accounting and cash settlement remain subject to confirmation. [7] [10] [15] [17]
The initial economic-claim subtotal is approximately 282.995m: June actual shares 261.080388m + Claros contractual closing shares 6.912729m + June RSUs 7.751m + legacy options 1.337494m + assumed Claros options 2.395762m + maximum contingent earnout 1.289869m + estimated employee performance awards 2.228219m. The last item is a reference equivalent of $28.9m ÷ $12.97, not a verified final award count. We add 2.3m further claims for H2 2026 and annual allowances of 7m / 8m through 2035 for partial / scaled success. The strong case uses 8m. [7] [17] [18]
These are gross economic claims, not current shares outstanding or GAAP diluted EPS shares. We count specified options and contingent awards in full, assume no forfeitures and credit no exercise proceeds. This is conservative and can overstate dilution if awards do not vest. Fixed annual grants can also understate future dilution when a weaker share price requires more shares to deliver compensation. The settled SPAC earnout is already in June shares; the newly registered plan reserve is not treated as immediate issuance. [7] [19]
| US$m unless noted | Partial success | Scaled success |
|---|---|---|
| End-2029 cash | 209.058 | 281.352 |
| 2035 operating enterprise value | 1,047.147 | 3,649.203 |
| 2035 accumulated cash | 619.480 | 2,374.421 |
| Other investment − finance-lease proxy | 5.000 − 0.620 | 5.000 − 0.620 |
| 2035 equity value | 1,671.006 | 6,028.004 |
| 2035 economic claims, million | 348.295461 | 357.295461 |
| 2035 share value | $4.80 | $16.87 |
2035 enterprise value = 2036 revenue × economic EBIT margin × (1 − terminal tax rate) × (1 − perpetual growth ÷ terminal ROIC) ÷ (mature operating-asset discount rate − perpetual growth).
2035 share value = (enterprise value + accumulated cash + other investment − finance-lease proxy) ÷ economic claims. ROIC means return on invested capital; the growth/ROIC term reserves capital needed to fund continuing growth.
Partial / scaled mature economic operating margins are 20% / 25%, perpetual growth is 3%, terminal tax is 25%, terminal ROIC is 20% / 25%, and the mature operating-asset discount rate is 14%. The latter and the 14% current equity required return are conceptually distinct; they share a value here under a no-financial-borrowing assumption. From 2031 to 2035, revenue grows by 25.00%, 18.00%, 12.00%, 7.00%, 3.00% in partial success and 35.00%, 25.00%, 15.00%, 8.00%, 3.00% in scaled success. Exact modeled growth rates and the annual cash bridge are recorded below.
Economic margins improve linearly from the calculated 2030 level to the 2035 margin. From 2031, cash operating profit adds back assumed share compensation of 8% of revenue and depreciation of 2%; annual cash tax is 20% of positive cash operating profit, gross capex is 4% of revenue, and incremental working capital is 20% of positive revenue growth. Through 2035 compensation is charged through new claims rather than deducted as a cash payment. From 2036 onward, future compensation remains an expense in the mature economic margin, without also adding the same future grants to the 2035 denominator.
The two core paths retain cash at zero interest, with no dividends, buybacks, additional acquisitions, new borrowing or cash equity raises. Large terminal cash balances depend on that policy. The $5m minority investment remains at cost and may be impaired. Operating rent is included in costs; we therefore do not also subtract the rent liability. We deduct a fixed $0.620m finance-lease proxy and exclude its principal payment from the operating cash budget to avoid double counting. These are modeling simplifications, not promised capital-allocation decisions.
7. A stronger upside test
We also tested a stronger outcome rather than assuming $16.87 is the limit of success. Management estimates an expanded 2030 serviceable market of about $8bn. Our leadership test assumes $1.6bn of 2030 revenue, equivalent in scale to 20% of that estimate. This is not evidence of awarded market share: the market estimate is a company forecast, and its scope does not perfectly match every revenue line in our model. [21]
This path keeps scaled-success revenue through 2029, then requires approximately 195% growth to $1.6bn in 2030. It assumes 56% cash gross margin and $400m cash operating expense in 2030, yielding a 21% economic EBIT margin after the 8% compensation and 2% depreciation charges. Revenue then grows 30%, 25%, 20%, 15% and 8% through 2035; economic EBIT margin rises to 30%. These are demanding success conditions, not our new Base case.
For this more mature leadership business, the operating-asset discount rate falls to 12%, while the current equity required return stays at 14%. Terminal growth remains 3%, terminal ROIC is 30%, and terminal tax is 25%. Annual operating cash tax is 20%, gross capex 4% of revenue, incremental working capital 20% of positive revenue growth, and after-tax interest 2% of starting cash. This more favorable capital treatment is shown explicitly rather than hidden in the comparison.
| Strong-case bridge | December 2035 |
|---|---|
| Revenue | $3,875.04m |
| Enterprise value | $8,980.405m |
| Accumulated cash | $4,002.063m |
| Other investment − finance lease | $5.000m − $0.620m |
| Economic claims | 357.295461m |
| Conditional share value | $36.35 |
| October 2026 equivalent | $10.86 |
Worked strong-case valuation: 3,875.04 × 1.03 × 30% × 75% × (1 − 3%/30%) ÷ (12% − 3%) = $8,980.405m enterprise value. Add $4,002.063m cash and $5m investment, subtract $0.620m finance lease, and divide by 357.295461m claims: $36.35 in December 2035. Discounting the unrounded result at 14% for 9.221081 years gives $10.86.
| Sensitivity under strong operations | October 2026 equivalent |
|---|---|
| 8m new claims annually in 2030–2035; cash retained | $10.86 |
| 16m new claims annually; same operating/cash path | $9.57 |
| Distribute year-end cash above $100m from 2030 | $11.88 |
The strong retained-cash result is close to the $10.78 reference price. Better execution, a longer growth period or different capital allocation can produce higher values, so $10.86 is not an objective ceiling. But a demanding success case near the market price does not establish an attractive margin of safety. Failure and weaker outcomes still matter. This is why we remain interested in the business while finding new purchases difficult to justify on the present evidence.
8. Failure risk and limits of the model
A material or near-total loss is possible if products fail to win sustainable production business, costs remain high and financing eventually fails or becomes severely dilutive. That does not make today’s cash worthless. In one explicit failure stress, annual revenue falls to $30m / $20m / $10m / $0 across 2027–2030 and annual cash use is $84.5m / $92m / $100m / $103m. Starting from the estimated $386.009m, year-end cash falls to $301.509m / $209.509m / $109.509m / $6.509m. If the last burn rate continues, cash runs out in early 2031; earlier cost overruns could bring funding pressure forward.
This is an AHNIM stress test, not a bankruptcy prediction. Equity approaches zero only when realizable assets and financing options fail to cover ongoing burn, senior claims and exit costs, or dilution transfers most value away from existing owners. We do not assign a positive cash-based price floor or pretend that partial success is the worst possible outcome. Terminal margins, growth duration and dilution are especially uncertain; many different outcomes remain possible.
9. Continuing coverage and future revisions
Coverage continues. Our current stance remains cautious on new purchases. We will report material Navitas news, products, customer adoption, results and financing developments even while the shares lack a demonstrated margin of safety in our analysis. We will raise or lower scenario values when evidence changes the model. A news update is not automatically an investment endorsement.
| New evidence | Model change and publication decision |
|---|---|
| Paid production orders, shipments, delivery dates and customer adoption | Revisit eligible deployments, captured content, unit revenue and timing; include cancellation/execution risk. |
| Claros processor shipments and recognized revenue | Replace assumed units and $50 net content with supported economics; update costs and working capital too. |
| Results, gross margins and cash flow | Reconcile actuals against the revenue/cost path and update the cash runway and mature economics where justified. |
| Share awards, offerings, acquisition settlement or debt | Update net cash and economic claims together; remove settled awards from overhang to avoid duplication. |
| Reference designs, ecosystem partnerships and prototypes | Record technical progress. Keep model inputs unchanged if the release supplies no support for a quantitative revision; mark material unresolved assumptions under review. |
| Lost customers, foundry delays, competition or legal outcomes | Revisit timing, pricing, costs and competitive durability; disclose any downward revision as clearly as an upward one. |
Each material update will show prior input → revised input → source and reason → cash/share impact → revised scenario value. We will keep the information date, valuation endpoint and discount-rate convention visible. When evidence supports retaining an estimate, we will explain why; when it does not resolve a key input, we will say the assumption remains under review.
Calculation appendix: annual cash and operating assumptions
Partial success
| Year | Cash gross margin / cash operating expense | Capex / working-capital increase, $m |
|---|---|---|
| 2027 | 40% / $80.0m | 5.000 / 1.530 |
| 2028 | 45% / $95.0m | 7.000 / 9.051 |
| 2029 | 50% / $130.0m | 10.000 / 28.152 |
| 2030 | 54% / $220.0m | 20.000 / 47.975 |
| Year | Revenue / cash operating result, $m | Year-end cash, $m | Economic claims, m |
|---|---|---|---|
| 2027 | 55.859 / -57.656 | 321.823 | 292.295461 |
| 2028 | 101.112 / -49.499 | 256.273 | 299.295461 |
| 2029 | 241.875 / -9.062 | 209.058 | 306.295461 |
| 2030 | 481.750 / 40.145 | 173.199 | 313.295461 |
| 2031 | 602.188 / 76.276 | 186.045 | 320.295461 |
| 2032 | 710.581 / 120.798 | 232.582 | 327.295461 |
| 2033 | 795.851 / 169.781 | 319.519 | 334.295461 |
| 2034 | 851.561 / 218.567 | 449.168 | 341.295461 |
| 2035 | 877.107 / 263.132 | 619.480 | 348.295461 |
Scaled success
| Year | Cash gross margin / cash operating expense | Capex / working-capital increase, $m |
|---|---|---|
| 2027 | 42% / $85.0m | 5.000 / 6.608 |
| 2028 | 48% / $115.0m | 10.000 / 25.250 |
| 2029 | 54% / $180.0m | 15.000 / 67.100 |
| 2030 | 56% / $300.0m | 33.000 / 110.225 |
| Year | Revenue / cash operating result, $m | Year-end cash, $m | Economic claims, m |
|---|---|---|---|
| 2027 | 81.250 / -50.875 | 323.526 | 293.295461 |
| 2028 | 207.500 / -15.400 | 272.876 | 301.295461 |
| 2029 | 543.000 / 113.220 | 281.352 | 309.295461 |
| 2030 | 1,094.125 / 312.710 | 388.295 | 317.295461 |
| 2031 | 1,477.069 / 441.122 | 605.521 | 325.295461 |
| 2032 | 1,846.336 / 575.106 | 917.899 | 333.295461 |
| 2033 | 2,123.286 / 688.631 | 1,328.482 | 341.295461 |
| 2034 | 2,293.149 / 773.162 | 1,821.314 | 349.295461 |
| 2035 | 2,361.944 / 826.680 | 2,374.421 | 357.295461 |
Strong leadership: 2030–2035 cash bridge
| Year | Revenue / economic EBIT margin | Cash tax / capex / Δworking capital, $m | Year-end cash, $m |
|---|---|---|---|
| 2030 | 1,600.00m / 21.0% | 99.20 / 64.00 / 211.40 | 408.379 |
| 2031 | 2,080.00m / 22.8% | 136.45 / 83.20 / 96.00 | 783.139 |
| 2032 | 2,600.00m / 24.6% | 179.92 / 104.00 / 104.00 | 1,310.482 |
| 2033 | 3,120.00m / 26.4% | 227.14 / 124.80 / 104.00 | 2,016.435 |
| 2034 | 3,588.00m / 28.2% | 274.12 / 143.52 / 93.60 | 2,916.137 |
| 2035 | 3,875.04m / 30.0% | 310.00 / 155.00 / 57.41 | 4,002.063 |
Investment information: This article is investment analysis for information and education, not personalized investment advice or an offer to buy or sell securities. Estimates may be wrong; returns and principal are not guaranteed, and a total loss is possible. Readers must independently verify original filings, current prices, assumptions and risks before investing and make their own decisions. To the extent permitted by applicable law, AHNIM STUDIO accepts no liability for losses arising from reliance on this material; this notice does not exclude obligations that cannot lawfully be excluded. The site’s full investment-information notice also applies.
Sources & original links
Original filings, company releases and technical publications. Company statements express management views. Accessed October 11, 2026.
[1] Navitas 2025 Form 10-K
2026-02-27
https://www.sec.gov/Archives/edgar/data/1821769/000182176926000007/nvts-20251231.htm
[2] NVIDIA — Building the 800 VDC ecosystem
2025-10-13
https://developer.nvidia.com/blog/building-the-800-vdc-ecosystem-for-efficient-scalable-ai-factories/
[3] Navitas Q2 2026 financial results and GAAP / non-GAAP reconciliation
2026-07-27
https://www.sec.gov/Archives/edgar/data/1821769/000162828026049795/exhibit991-navitassemicond.htm
[4] Navitas Q1 2026 financial results
2026-05-05
https://ir.navitassemi.com/news-releases/news-release-details/navitas-semiconductor-announces-first-quarter-2026-financial
[5] Navitas Q4 and full-year 2025 financial results
2026-02-24
https://ir.navitassemi.com/news-releases/news-release-details/navitas-semiconductor-announces-fourth-quarter-and-full-year-0
[6] Navitas Q3 2025 financial results
2025-11-03
https://ir.navitassemi.com/news-releases/news-release-details/navitas-semiconductor-announces-third-quarter-2025-financial
[7] Navitas Form 10-Q for the quarter ended June 30, 2026
2026-07-27
https://www.sec.gov/Archives/edgar/data/1821769/000162828026049808/nvts-20260630.htm
[8] Claros merger agreement — Form 8-K, agreement signed August 24
2026-08-25
https://www.sec.gov/Archives/edgar/data/1821769/000110465926100478/tm2623854d1_8k.htm
[9] Claros acquisition announcement
2026-08-24
https://www.sec.gov/Archives/edgar/data/1821769/000110465926100478/tm2623854d1_ex99-1.htm
[10] Claros acquisition closing — Form 8-K
2026-10-06
https://www.sec.gov/Archives/edgar/data/1821769/000110465926114051/tm2626897d3_8k.htm
[11] Claros acquisition closing — company release
2026-10-06
https://www.sec.gov/Archives/edgar/data/1821769/000110465926114051/tm2626897d3_ex99-1.htm
[12] GlobalFoundries — Gen 5 GaN production milestones
2026-09-01
https://www.globenewswire.com/news-release/2026/09/01/3354123/0/en/navitas-delivers-latest-gen-5-ganfast-manufactured-in-the-u-s-through-globalfoundries-partnership-to-accelerate-ai-infrastructure.html
[13] Navitas and Microchip — 800 V to 6 V reference design
2026-10-05
https://www.globenewswire.com/news-release/2026/10/05/3374545/0/en/navitas-and-microchip-collaborate-to-deliver-800v-reference-design-for-next-generation-ai-data-centers.html
[14] Navitas announces patent lawsuit against Renesas
2026-08-10
https://www.globenewswire.com/news-release/2026/08/10/3342210/0/en/navitas-files-patent-infringement-lawsuit-against-renesas-electronics.html
[15] Magnachip investment agreement — Form 8-K/A
2026-09-21
https://ir.navitassemi.com/node/12036/html
[16] Navitas Q2 2026 earnings presentation — Navitas 2.0 strategy
2026-07-27
https://www.sec.gov/Archives/edgar/data/1821769/000162828026049795/exhibit992-navitas2q26ea.htm
[17] Claros consideration and employee awards — Form S-4
2026-09-08
https://www.sec.gov/Archives/edgar/data/1821769/000110465926105967/tm2624896-1_s4.htm
[18] Claros assumed options — Form S-8
2026-10-06
https://www.sec.gov/Archives/edgar/data/1821769/000110465926114085/tm2626897d1_s8.htm
[19] Equity plan reserve and pro forma basic-share planning basis — Form S-8
2026-10-06
https://www.sec.gov/Archives/edgar/data/1821769/000110465926114090/tm2626897d2_s8.htm
[20] Navitas Q2 investor presentation — financial outlook and production roadmap, PDF
2026-07-27
https://ir.navitassemi.com/static-files/442d8026-a895-4d9d-9e1f-65f01fcc75a6
[21] Claros acquisition presentation — market scope and 2028–2029 timing
https://www.sec.gov/Archives/edgar/data/1821769/000110465926100478/tm2623854d1_ex99-2.htm
[22] Navitas Citi conference transcript — September 8, 2026
https://ir.navitassemi.com/static-files/4511e3f5-3c0a-4f7b-bbf0-0e8206fdb66b
[23] Navitas August 2025 presentation — historical GPU power forecast used only as a model benchmark
https://ir.navitassemi.com/static-files/f171325e-5000-467f-8a96-00b76847ccb1
[24] MarketWatch — NVTS, October 9, 2026 regular-session close
https://www.marketwatch.com/investing/stock/nvts
[25] NVIDIA — 800 VDC power architecture and AI factory roadmap
https://blogs.nvidia.com/blog/800-vdc-power-architecture-ai-factory/


Leave a Reply