
AHNIM STUDIO · News analysis · Bloom Energy (NYSE: BE)
Analysis date: October 11, 2026. This article examines September project and factory updates against the latest reported financial period, the second quarter of 2026.
October 12 valuation update: this article now uses $71 Bear / $216 Base / $377 Bull for end-2027, based on the revised fundamental model and 2028 earnings. Base is 24.1% below the analyst mean of $284.74. We add no separate price uplift for the overlapping Oracle disclosures or unquantified Fremont capacity. Section 5 distinguishes the model revision from the news decision.
Oracle’s data-center demand and Bloom Energy’s Fremont manufacturing expansion strengthen two parts of the growth case: customers seeking power and the ability to supply equipment. Our assessment is positive on the commercial opportunity. The financial question is how much equipment becomes revenue, when it does so, and how much cash remains after delivery and expansion.
One correction to the property story: the public evidence establishes that Bloom secured additional production space, but does not conclusively establish a land purchase. Fremont described an acquisition; a subsequent business-journal report described a lease. We therefore use “facility expansion.” [1] [2]
1. Oracle demand: different numbers, overlapping scope
Bloom’s April announcement combined an initial contracted amount with a larger procurement framework. Oracle then identified a specific power design for Project Jupiter in New Mexico. These figures describe overlapping arrangements, not separate quantities that can be added together. [3] [4]
| Published figure | Date | What it represents |
|---|---|---|
| 1.2 GW initially contracted; up to 2.8 GW framework | April 13, 2026 | Initial contracted deployment and Oracle’s broader procurement intention; deployment continuing into 2027. |
| Up to 2.45 GW | April 27, 2026 | Project Jupiter’s planned installed fuel-cell capacity, within the expanded partnership. |
| 2.4 GW | September 24, 2026 | Bloom’s statement about its Jupiter contract, quoted by Stocktwits News the following day. |
For the September figure, we reviewed the accessible report quoting Bloom and linking its original X post; direct retrieval of that post was unavailable. It supports attribution to the company, not independent inspection of the purchase contract. The statement reinforces the relationship, but does not establish a newly incremental September order. [5] [6]
Large project commitments are commercially meaningful because they can support production planning and repeated deliveries. The revenue opportunity nevertheless depends on the contracted equipment, pricing, delivery schedule and transfer of control. A project’s total gigawatts cannot be treated as one year of recognized sales.
2. Fremont expansion: additional space, unquantified output
On September 22, Fremont announced a 158,000-square-foot facility on Encyclopedia Circle. The city did not provide a transaction price, commissioning date or incremental production target for the building. The September 30 Silicon Valley Business Journal headline and accessible excerpt described a 158,500-square-foot lease; the full report was access-restricted. [1] [2]
The distinction changes how we assess cash commitments, but the operating significance is straightforward: more suitable space can support equipment installation, staffing and production flow. It can reduce the risk that Bloom’s own factory becomes a delivery constraint. Floor area alone does not establish qualified capacity, utilization or revenue.
The city also referred to eventual support for 5 GW. Bloom’s April investor presentation had already described existing facilities as scalable to 5 GW as needed. The September reference therefore does not establish an additional 5 GW, or completed operating capacity. Manufacturing capacity is an annual production capability; Oracle’s project figures describe installed equipment across deployments. They should not be added or compared as equivalent annual sales. [1] [11]
3. Revenue growth already in the company outlook
Bloom reported approximately $2.024 billion of revenue in 2025. Its July 28 outlook called for $3.9–4.2 billion in 2026, implying approximately 93–108% annual growth. That outlook predates the September facility news and follows the April Oracle announcements. We found no subsequent official revenue-guidance increase attributed to the new Fremont space as of our research date. [9] [10]
The first half generated $1.816419 billion. Subtracting that result from the annual outlook gives the revenue needed in the second half to reach each endpoint. This is our arithmetic, not separate company guidance. [9] [12]
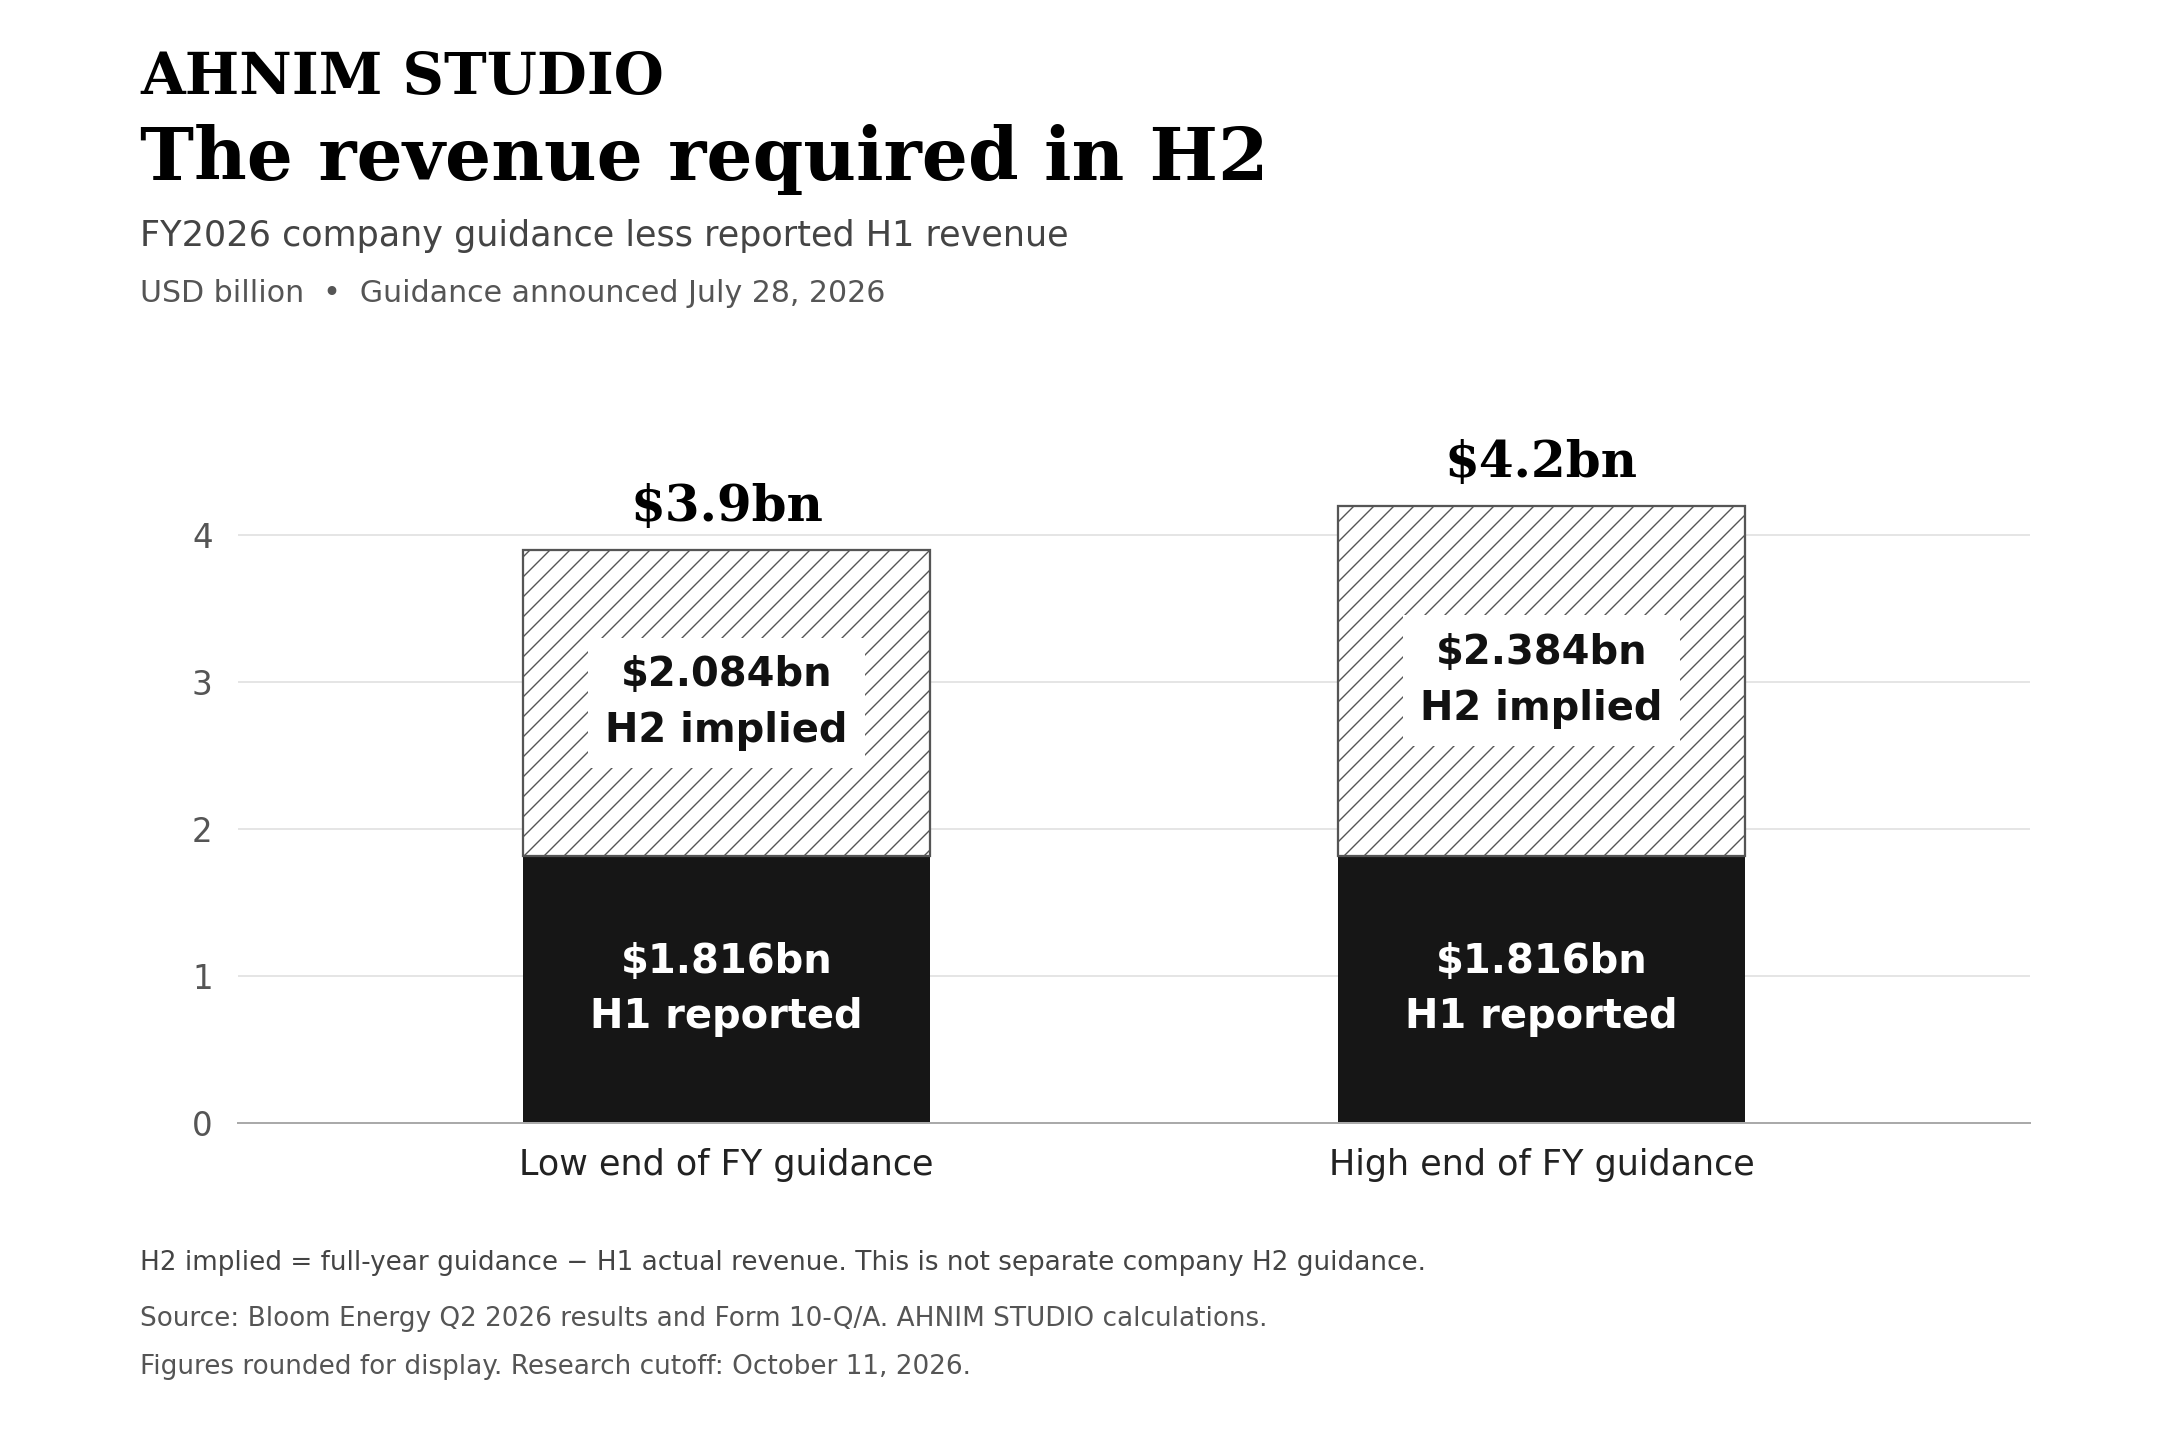
The implied second-half quarterly average is $1.042–1.192 billion, approximately 2.2% below to 11.9% above the second quarter’s $1.065365 billion. This does not predict either quarter individually. It shows that the annual range requires delivery at around, or above, the level already reached in Q2—not an entirely hypothetical future factory’s output. [9] [12]
For investors, the facility news strengthens confidence in the ability to serve demand over time. It does not supply a separate revenue amount to stack on top of existing guidance. Estimating additional sales requires disclosure of incremental qualified capacity, customer allocation and the timing of deliveries.
4. Delivery, recognition and cash
Product revenue generally follows contractual transfer of control, which may occur at delivery, mechanical completion or operation. Installation revenue is recognized as work progresses, while maintenance revenue spans the service period. A facility announcement creates none of these revenue events by itself; equally, not every product contract requires an operating plant before recognition. [10]
Project timing remains relevant. On September 30, Oracle and STACK said flooding had caused no critical infrastructure damage and Jupiter remained on its planned schedule. That is their assessment. The New Mexico environmental docket still showed procedural activity through October 9; we did not identify final air-permit approval in the reviewed record. An unchanged company schedule and an unfinished regulatory process can coexist. [7] [8]
Growth must also fund itself economically. Hiring, equipment and inventory can absorb cash before customer payments arrive. Faster shipments are more valuable when margins hold, receivables convert into cash and expansion costs remain proportionate to demand.
5. Valuation update and analyst comparison
Updated October 12, 2026: Bear $71 / Base $216 / Bull $377. Model AHNIM-BE-M3-forward-EBITDA values FY2028 earnings at December 31, 2027. These are conditional market-valuation scenarios, not present intrinsic values, guaranteed prices or 12-month targets. The company has not guided to our 2027–2028 forecasts. No probabilities are assigned to the cases.
20% divergence flag: our Base target is 24.1% below the analyst mean. The mean is $284.74, median $303 and published range $97–390. Stock Analysis identifies 29 analysts; its displayed update date is October 7, checked October 12, 2026. Investing.com also shows $284.74. These are generally rolling 12-month targets, whereas ours is end-2027; the comparison is a screening flag, not a fully horizon-matched valuation. [V1] [V2]
| Scenario | AHNIM target | Vs. analyst mean $284.74 | Vs. median $303 |
|---|---|---|---|
| Bear | $71 | -75.1% | -76.6% |
| Base | $216 | -24.1% | -28.7% |
| Bull | $377 | +32.4% | +24.4% |
Forecasts, formula and reproducible targets
| AHNIM assumption | Bear | Base | Bull |
|---|---|---|---|
| 2027 revenue, US$m | 4,500 | 6,500 | 8,000 |
| 2028 revenue, US$m | 5,250 | 8,500 | 11,250 |
| 2028 adjusted EBITDA margin | 20% | 27% | 31% |
| 2028 adjusted EBITDA, US$m | 1,050 | 2,295 | 3,487.5 |
| EV / adjusted EBITDA | 22× | 30× | 35× |
| Equivalent EV / 2028 sales | 4.40× | 8.10× | 10.85× |
| Enterprise value, US$m | 23,100 | 68,850 | 122,062.5 |
| End-2027 cash incl. option proceeds, US$m | 2,441.172997 | 3,041.172997 | 3,541.172997 |
| Remaining face debt, US$m | 2,500 | 0 | 0 |
| Other claims deducted, US$m | 239.899 | 239.899 | 239.899 |
| Economic diluted claims, millions | 319.636729 | 332.459229 | 332.459229 |
| Calculated value per share | $71.334962 | $215.518980 | $377.080144 |
| Published target | $71 | $216 | $377 |
Target = (2028 revenue × adjusted EBITDA margin × EV/EBITDA + end-2027 cash − remaining debt − other claims) / economic diluted claims.
Bear: (5,250 × 20% × 22 + 2,441.172997 − 2,500 − 239.899) / 319.636729 = $71.33.
Base: (8,500 × 27% × 30 + 3,041.172997 − 0 − 239.899) / 332.459229 = $215.52.
Bull: (11,250 × 31% × 35 + 3,541.172997 − 0 − 239.899) / 332.459229 = $377.08. Calculations use unrounded inputs.
The 2026 company revenue guide is $3.9–4.2 billion. Our 2027 growth over its $4.05 billion midpoint is 11.1% / 60.5% / 97.5%; 2028 growth is 16.7% / 30.8% / 40.6%. Bear assumes slower deployment and margin pressure, not insolvency or a guaranteed downside floor. Base assumes major orders become shipments and customers are ready to accept equipment. Bull additionally requires faster production, more customers and stronger economics. The forecasts are top-down AHNIM scenarios, not a customer-by-customer contracted revenue schedule. [V7]
The margin assumptions imply adjusted gross margins of 32% / 36% / 39%, adjusted operating costs of 14% / 11% / 10% of sales, and depreciation and amortization of 2% of sales. Thus adjusted EBIT margins of 18% / 25% / 29% become EBITDA margins of 20% / 27% / 31%. This is a consistency bridge, not independent proof of the forecasts. Adjusted EBITDA excludes stock compensation and is not GAAP profit or free cash flow.
We no longer treat the end-2026 2 GW plan as a permanent ceiling: the April investor presentation describes existing facilities as scalable to 5 GW as needed. That is not 5 GW commissioned today or a dated output forecast. The Fremont space announcement provides no independently quantified shipment uplift. Higher forecasts reflect our reassessment of the growth path and execution assumptions, not an extra order manufactured by adding overlapping Oracle figures. [V6]
Why our Base differs from brokers
Public reports of April 29 valuation examples describe Evercore using about $2.8 billion of 2028 EBITDA at 27.5× and TD Cowen using about $2.9 billion at 26×. Our Base EBITDA of $2.295 billion is lower, while our 30× multiple is higher. The earnings forecast therefore explains part of the difference; it would be incorrect to blame only a low multiple. These are historical examples reported by a secondary source, not today’s full earnings consensus or independently reproduced broker models. We do not have their complete cash, debt and share bridges. [V3] [V4]
Our 22× / 30× / 35× multiples are explicit judgments about growth, execution and cash economics, not measured peer medians. Holding the Base earnings forecast and capital rules fixed, 25×–35× produces roughly $180–250. Bull at 30×–40× produces roughly $325–430. These are sensitivities, not confidence intervals. The 24.1% divergence remains disclosed; we have not increased the target simply to fall inside the consensus band.
Cash, convertible debt and dilution
The capital snapshot begins at June 30, 2026. Cash = $2,666.859m reported unrestricted cash − $3.370m assumed repayment ($0.787m residual 2028 notes plus a $2.583m Korean joint-venture loan) + $77.683997m option exercise proceeds + cumulative H2 2026–2027 net cash generation of −$300m / +$300m / +$800m. The cash-generation cases include net investment and working-capital effects as a top-down assumption. They are retained from the previous model for comparability and have not been rebuilt from a detailed customer and capex schedule despite higher revenue forecasts; this limits confidence. [V5]
| Share component | Millions of shares | Treatment |
|---|---|---|
| June 30 common shares | 293.354001 | Starting count |
| Unsettled conversion commitments | 0.877687 | Add once |
| Outstanding RSU / PSU awards | 10.101219 | Count in full as economic claims |
| Outstanding options | 5.009767 | Add gross shares and associated exercise cash |
| 2029-note conversion shares | 1.294055 | Convert economically in all three cases; remove $26.971m principal |
| Future grant / ESPP allowance | 9.000000 | Through end-2028; prior allowance was 5.4m through end-2027 |
| Subtotal before 2030 conversion | 319.636729 | Bear denominator |
| 2030-note conversion shares | 12.822500 | Base and Bull only, paired with removal of $2,500m debt |
| Base / Bull denominator | 332.459229 | Both include 2030 conversion |
The 9.0m future allowance is H1 new RSU/PSU grants of 1.142215m plus ESPP issuance of 0.644651m, multiplied by five half-years to end-2028: 8.934330m, rounded to 9.0m. This adds 3.6m claims versus the prior allowance, with no additional assumed ESPP proceeds. Option cash is 1.672079m × $25.58 + 3.337688m × $10.46 = $77.683997m. The 2.154231m Oracle warrant shares are already inside June common shares and are not added again. The Q2 weighted-average EPS denominator is not the valuation denominator. [V5]
The 2030 notes convert economically above approximately $194.97 in this model. Base and Bull clear that level; Bear retains $2.5bn face debt. This pairs debt removal with extra shares and does not claim legal conversion has already occurred. Other claims are $206.480m financing obligations + $4.746m finance leases + $28.673m noncontrolling interests = $239.899m. We deduct the full financing-obligation book value conservatively; ordinary operating leases remain within operating expenses. Restricted cash, capped-call value and equity-method investment value receive no credit. Legal settlement choices, option time value and future financing could change the result. [V5]
Dated changes and the earlier upside discussion
| Published scenario | October 11 model | October 12 model | Change |
|---|---|---|---|
| Bear | $66 | $71 | +7.6% |
| Base | $140 | $216 | +54.3% |
| Bull | $265 | $377 | +42.3% |
The earlier archive recorded $66 / $205 / $390 with an insufficiently specified target date. The October 11 model changed these to $66 / $140 / $265 using 2027 sales multiples of 5× / 8× / 12×, mainly a valuation-policy reset. This October 12 revision retains the end-2027 target date, raises 2027 sales from $4.2 / $5.5 / $7.0bn to $4.5 / $6.5 / $8.0bn, looks forward to 2028 earnings and replaces sales multiples with explicit EBITDA margins and multiples. The older figures remain historical, not current targets.
| Controlled model bridge, US$/share | Bear | Base | Bull |
|---|---|---|---|
| Prior 2027 sales × 5 / 8 / 12, with prior capital rules | 65.50 | 140.18 | 265.47 |
| Revise 2027 revenue only | 70.25 | 165.49 | 301.96 |
| Use 2028 revenue at the old sales multiples | 82.11 | 215.29 | 420.55 |
| Use new EBITDA margins × 22 / 30 / 35 | 72.15 | 217.88 | 381.21 |
| Add 3.6m further 2028 economic claims | 71.33 | 215.52 | 377.08 |
A previously discussed $360 target could not be tied to a verified original formula and is not inserted into the official revision history as fact. It can be explained under the current Bull earnings assumptions at about 33.4× EBITDA. The archived $600 illustration used EPS $10 × P/E 60 and was an extreme-upside case. With current Bull cash and share assumptions held fixed, $600 would require about 56.3× Bull EBITDA, or about $18.08bn revenue at a 31% margin and 35× multiple. This reverse calculation is not a forecast; investment needs, cash and dilution would need rebuilding at that scale.
DCF as a supporting check
We use forward operating results and explicit market multiples for the headline targets. The separate DCF check produces end-2027 values of about $14.75 / $51.34 / $104.24 at a 13% assumed WACC. It is not a price ceiling and does not validate the higher market-multiple targets. We do not average the methods. Their gap highlights the importance of persistent growth, the price assigned to that growth, reinvestment and stock compensation.
That DCF starts with the same 2028 sales and EBITDA scenarios, projects cash flows through 2035, fades growth to 3%, assumes 25% tax, 2%-of-sales depreciation, and initial capex of 5% / 6% / 7% of sales. It charges post-2027 new compensation at 4% of revenue, uses 10% of incremental sales for working capital and terminal returns on invested capital of 15% / 20% / 25%. Its share denominator includes awards through 2027 and does not also add the market model’s 2028 allowance. The 2030 debt stays outstanding because the DCF outputs are below its conversion threshold. These are uncertain assumptions; 13% WACC is not automatically the same as an investor’s required return.
Reference standard and future revisions
Our fundamental analyses, news updates and evergreen company research share a common structure: dated evidence, investment implications, scenario targets or a maintain/change/under-review decision, the reasoning and calculation, analyst comparison, risks and original links. Article length and order vary by topic. General educational explainers use clearly labeled examples where useful rather than inventing a target. Korean and English versions of the same analysis use the same dated inputs and values.
For this and future AHNIM investment articles, we show the target date, earnings year, primary method, assumptions, shares, original sources and an investment-risk notice. DCF is a supporting test, selected according to business stage and forecast visibility. We compare published targets with a dated analyst mean, median and range where available. Difference = (AHNIM target / analyst mean − 1) × 100; an absolute gap of at least 20% triggers explicit explanation and review. We calculate the flag before rounding the percentage, focus on Base and label Bear/Bull comparisons separately. Unavailable coverage is disclosed; it is not treated as agreement. This check occurs when preparing or updating an article, not as continuous monitoring.
Our Base currently triggers that review. Differences in earnings forecasts, multiples, dilution and target horizons are disclosed above. Future updates will show previous and new values, the changed input and evidence, or explicitly maintain the target after review. Firm non-overlapping orders, customer readiness, commissioned output, margins, service costs, working capital, capex, permits and financing can alter the model. Missing material evidence results in an “under review” label, not an unsupported new target.
Decision on the Oracle and Fremont news
| Case | Revised fundamental baseline | After separate news overlay | Additional news uplift |
|---|---|---|---|
| Bear | $71 | $71 | 0% |
| Base | $216 | $216 | 0% |
| Bull | $377 | $377 | 0% |
The revised fundamental model already incorporates a stronger growth path. Oracle’s overlapping framework and project figures are not added together, and Fremont’s extra qualified output and ramp date remain unquantified. Therefore this article applies no additional revenue, cash or multiple uplift for those same announcements. Business-source and permit observations above retain their explicitly stated review dates; the October 12 update concerns valuation and analyst comparison.
Investment information: AHNIM STUDIO is a personal research team. This article provides investment analysis for information and education, not personalized investment advice or an offer to buy or sell securities. Estimates can be wrong, returns are not guaranteed and loss of capital is possible. Readers must independently verify original filings, current facts and risks before investing and make their own decisions. We do not guarantee accuracy, completeness or investment outcomes. To the extent permitted by applicable law, we accept no liability for losses from reliance on this material; this notice does not exclude obligations that cannot lawfully be excluded.
Sources & original links
Original filings, company statements, public records and identified news reports. Company statements express management views. Accessed October 11, 2026.
[1] Fremont Economy Monthly | September 2026
2026-09-22
https://content.govdelivery.com/accounts/CAFREMONT/bulletins/4293ade
[2] Bloom Energy leases 158,500-sq-ft Fremont plant for expansion — headline and search excerpt only; full article access restricted
2026-09-30
https://www.bizjournals.com/sanjose/news/2026/09/30/bloom-energy-fremont-manufacturing-expansion.html
[3] Bloom Energy and Oracle Expand Strategic Partnership to Deploy up to 2.8 GW
2026-04-13
https://investor.bloomenergy.com/press-releases/press-release-details/2026/Bloom-Energy-and-Oracle-Expand-Strategic-Partnership-to-Deploy-up-to-2-8-GW-to-Accelerate-AI-Infrastructure-Build-Out/default.aspx
[4] Oracle, BorderPlex, and Bloom Energy to Power Project Jupiter with Fuel Cell Technology
2026-04-27
https://www.oracle.com/news/announcement/oracle-borderplex-and-bloom-energy-to-power-project-jupiter-with-fuel-cell-technology-2026-04-27/
[5] BE Stock Eyes Best Month Since April: Oracle Reaffirms 2.4 GW Fuel Cell Deal Amid Project Jupiter Jitters — secondary report quoting Bloom’s statement
2026-09-25
https://stocktwits.com/news-articles/markets/equity/be-stock-oracle-reaffirms-fuel-cell-deal-amid-project-jupiter-jitters/cZMOGvmRBa0
[6] Bloom Energy statement on Oracle and Project Jupiter — original post linked by report; direct retrieval unavailable
2026-09-24
https://x.com/Bloom_Energy/status/2103192271202213975
[7] Project Jupiter Statement on Southern New Mexico Floods
2026-09-30
https://www.oracle.com/news/announcement/project-jupiter-statement-on-southern-new-mexico-floods-2026-09-30/
[8] AQB 26-57(P): Yucca Growth Infrastructure, LLC – YGI Microgrid (Project Jupiter)
docket through 2026-10-09
https://www.env.nm.gov/opf/aqb-26-57p-yucca-growth-infrastructure-llc-ygi-microgrid/
[9] Bloom Energy Q2 2026 financial results and full-year guidance
2026-07-28
https://investor.bloomenergy.com/press-releases/press-release-details/2026/Bloom-Energy-Reports-Record-Second-Quarter-2026-Financial-Results-and-Raises-Full-Year-2026-Guidance/default.aspx
[10] Bloom Energy FY2025 Form10-K
2026-02-09
https://www.sec.gov/Archives/edgar/data/1664703/000162828026006516/be-20251231.htm
[11] Bloom Energy April2026 InvestorPresentation
2026-04
https://s29.q4cdn.com/452919417/files/doc_presentations/2026/04/Investor-Presentation-PDF-April-2026.pdf
[12] Bloom Energy Q2 2026 Form 10-Q/A
2026-07-29
https://www.sec.gov/Archives/edgar/data/1664703/000162828026050325/be-20260630.htm
Valuation sources added October 12, 2026
[V1] Analyst targets and consensus forecasts; S&P Global data via Stock Analysis, page update October 7; checked October 12, 2026
https://stockanalysis.com/stocks/be/forecast/
[V2] Second public check of the analyst mean; analyst-count labels differ on this page, so the count used here is from V1
https://www.investing.com/equities/bloom-energy-corp-consensus-estimates
[V3] Evercore historical valuation formula, April 29, 2026; secondary reporting, not the full broker report or its latest target
https://www.investing.com/news/analyst-ratings/evercore-isi-raises-bloom-energy-stock-price-target-on-record-results-93CH-4644756
[V4] TD Cowen historical valuation formula, April 29, 2026; secondary reporting, not the full broker report or its latest target
https://www.investing.com/news/analyst-ratings/td-cowen-raises-bloom-energy-stock-price-target-on-ai-demand-93CH-4645437
[V5] Corrected Q2 2026 Form 10-Q/A: shares, cash, convertibles and other claims
https://www.sec.gov/Archives/edgar/data/1664703/000162828026050325/be-20260630.htm
[V6] April 2026 investor presentation: facilities scalable to 5 GW as needed
https://s29.q4cdn.com/452919417/files/doc_presentations/2026/04/Investor-Presentation-PDF-April-2026.pdf
[V7] Q2 2026 results and full-year company guidance
https://investor.bloomenergy.com/press-releases/press-release-details/2026/Bloom-Energy-Reports-Record-Second-Quarter-2026-Financial-Results-and-Raises-Full-Year-2026-Guidance/default.aspx


Leave a Reply