AHNIM STUDIO · Fundamental analysis · ALAB
Research cut-off: October 11, 2026. Latest reported quarter: June 30, 2026. Reference price: $342.21, October 9 regular-session close. All prices and financial amounts are US dollars. [Market data]
Our view: Astera Labs has a profitable business supplying connectivity for AI infrastructure. We see further growth opportunities, but the return available to shareholders depends on customer adoption, margins, dilution and the premium investors continue to pay. Our central twelve-month target is approximately $355. Our ordinary Bear and Bull cases are approximately $133 and $551. These are conditional scenarios, not probability-weighted forecasts or price floors.
| AHNIM scenario | Bear | Base | Bull |
|---|---|---|---|
| 2028 adjusted operating EPS proxy | $4.43 | $7.09 | $10.01 |
| Assumed forward P/E | 30× | 50× | 55× |
| October 2027 conditional target | $133.02 | $354.62 | $550.56 |
| Price change from $342.21 | -61.1% | +3.6% | +60.9% |
| Current conditional entry price at 13% | $117.72 | $313.82 | $487.22 |
The targets refer to approximately October 2027 and use 2028 earnings estimates. The separate current entry references divide each unrounded target by 1.13: they are prices that would deliver our assumed 13% return if that case materialized after one year, with no interim distributions. They are not independently established intrinsic values. This article separates an ordinary operating disappointment from the more severe growth-failure stress described below.
The business
Astera sells semiconductors, boards and modules that move data among processors, memory and networking equipment. Aries conditions PCIe/CXL signals; Scorpio provides fabric switching; Taurus addresses high-speed links; Leo supports memory connectivity. COSMOS adds configuration and diagnostics. We treat the software as part of the hardware proposition, rather than inventing a separate subscription revenue stream. [2025 10-K]
Our investment question is how much revenue and profit Astera can capture from increasingly complex systems. Industry spending alone is insufficient. A platform can grow while using fewer Astera components, switching suppliers or adopting a different architecture. Conversely, additional valuable connections per system can increase revenue faster than system shipments.
Reported growth and earnings quality
Q2 revenue was $392.4 million, up 104% year over year and 27% sequentially. GAAP gross margin was 73.3%; operating income was $89.248 million. Adjusted operating income of $153.472 million excluded $63.992 million of stock compensation and $0.232 million of acquisition-related costs. Q2 net income also benefited from a $50.263 million tax benefit, so we do not annualize reported EPS as normalized earnings. [Q2 results]
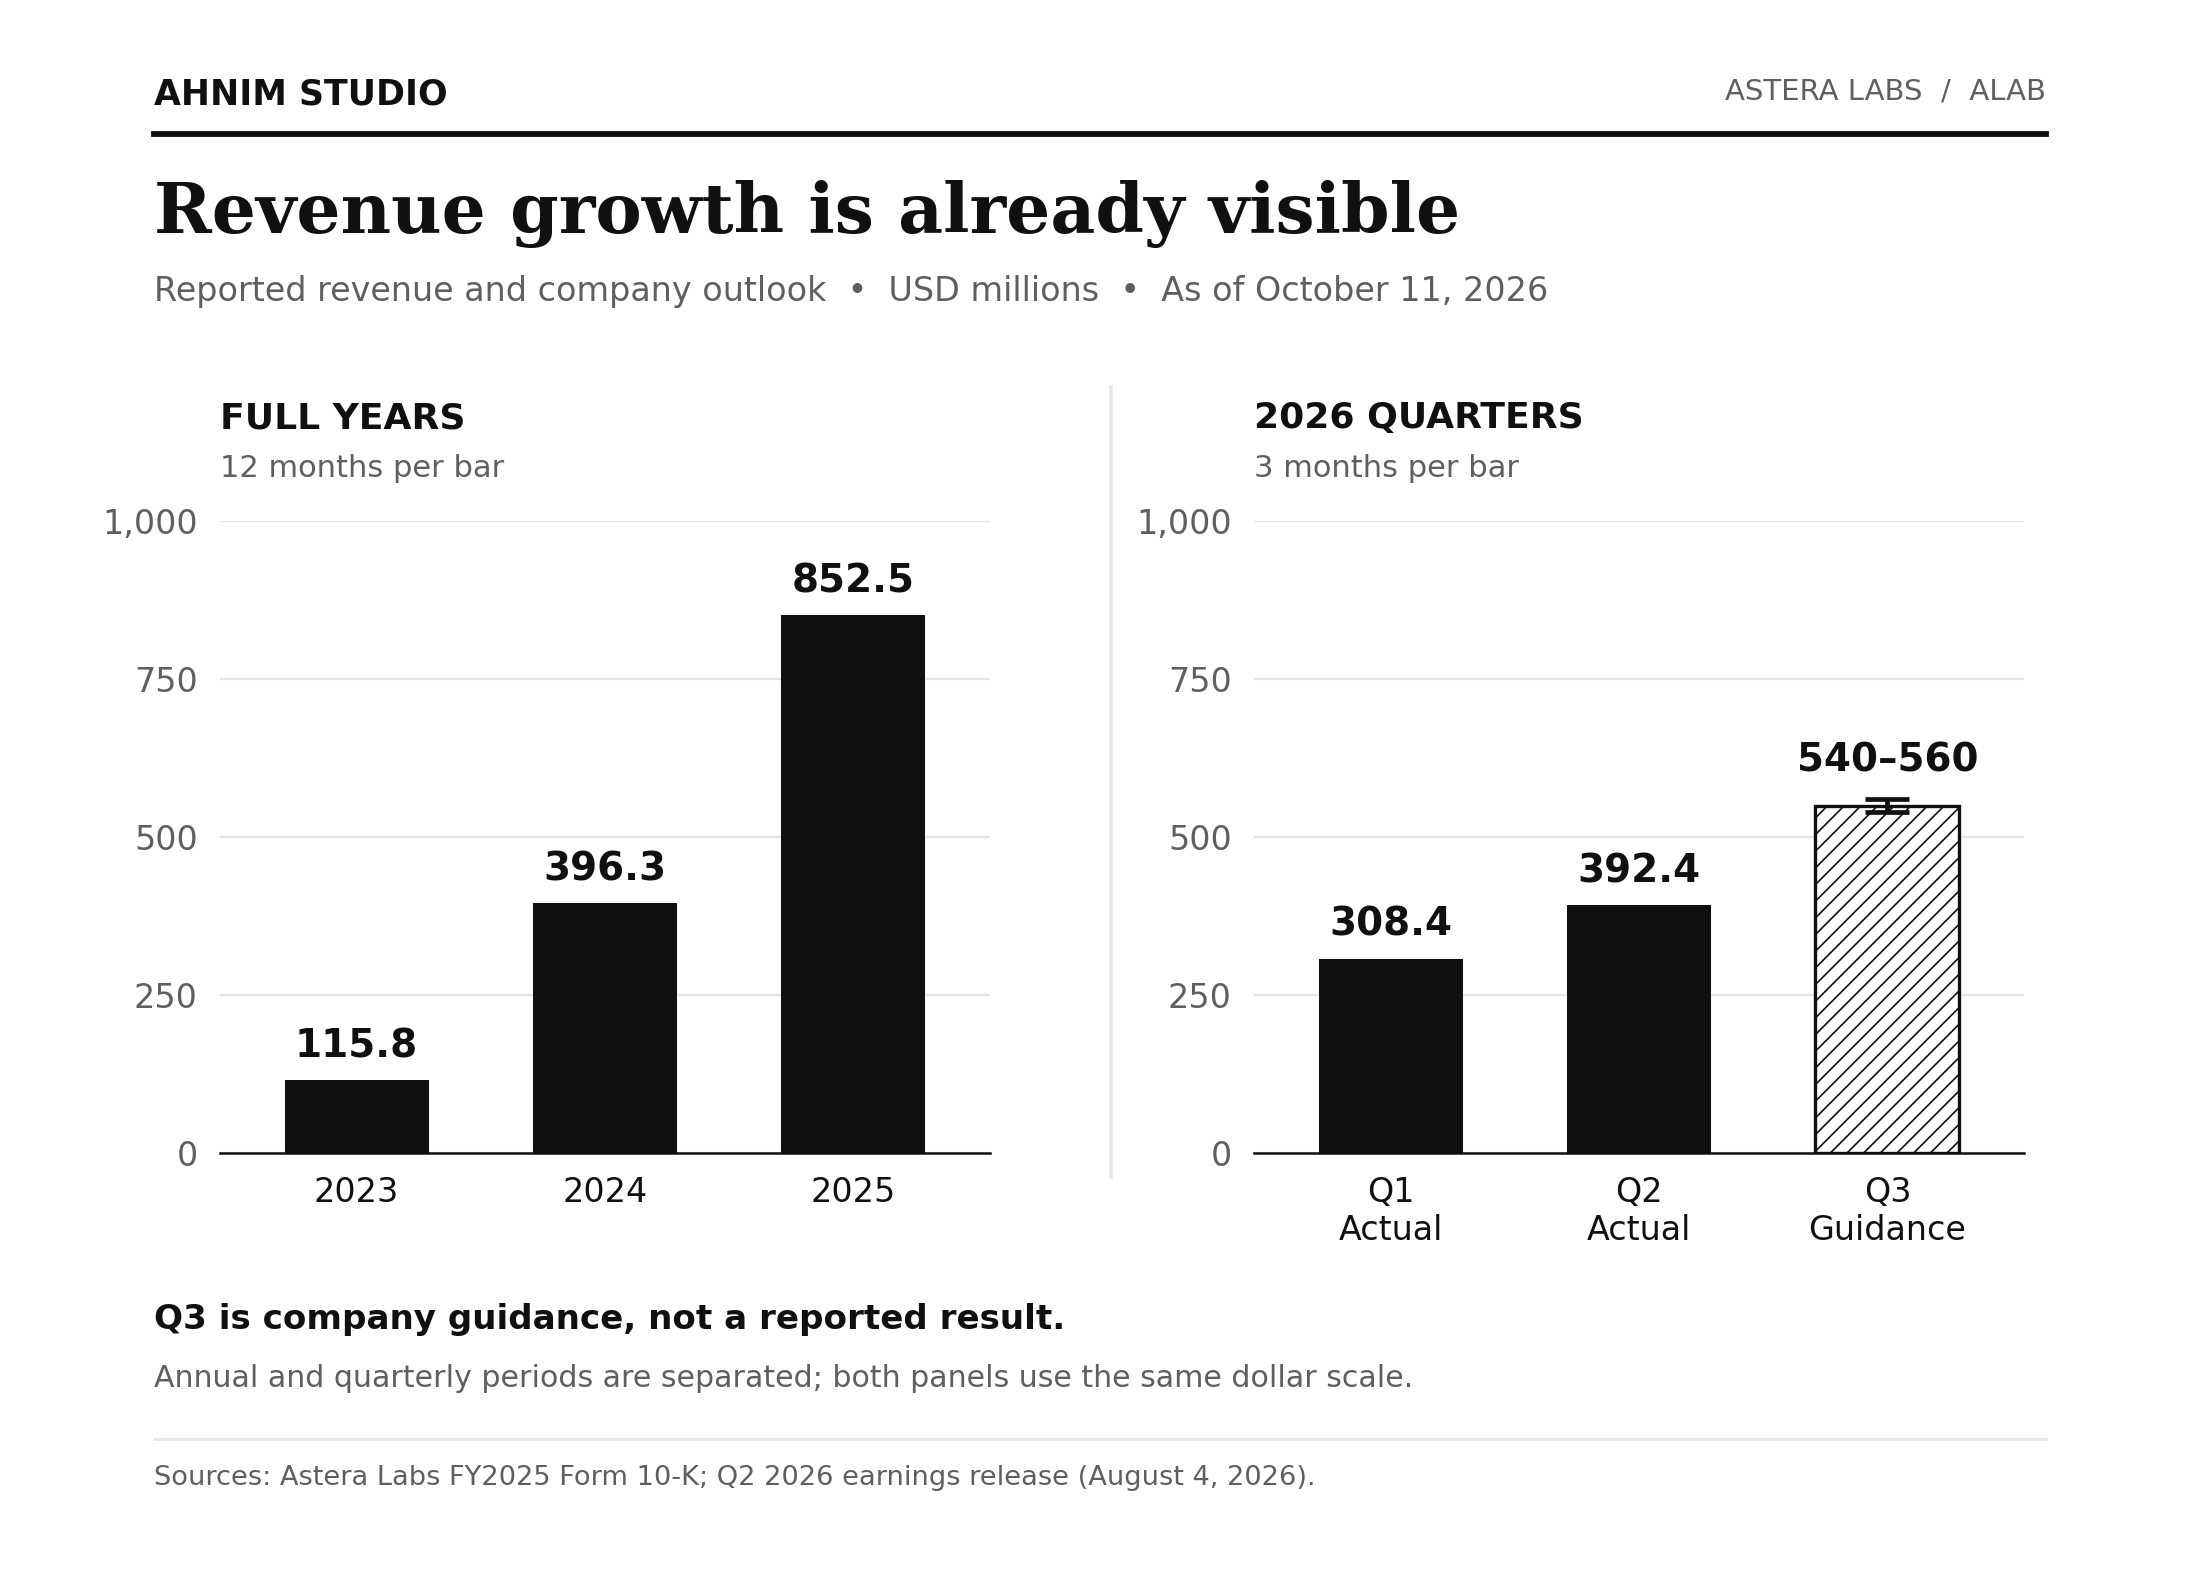
Management guided Q3 revenue to $540–560 million, gross margin to approximately 72% and adjusted operating expenses to $156–160 million. It expected Scorpio to become the largest product family in Q3. These remain forecasts at our cut-off; Q3 results are scheduled for November 3. [Q3 guidance] [Results calendar]
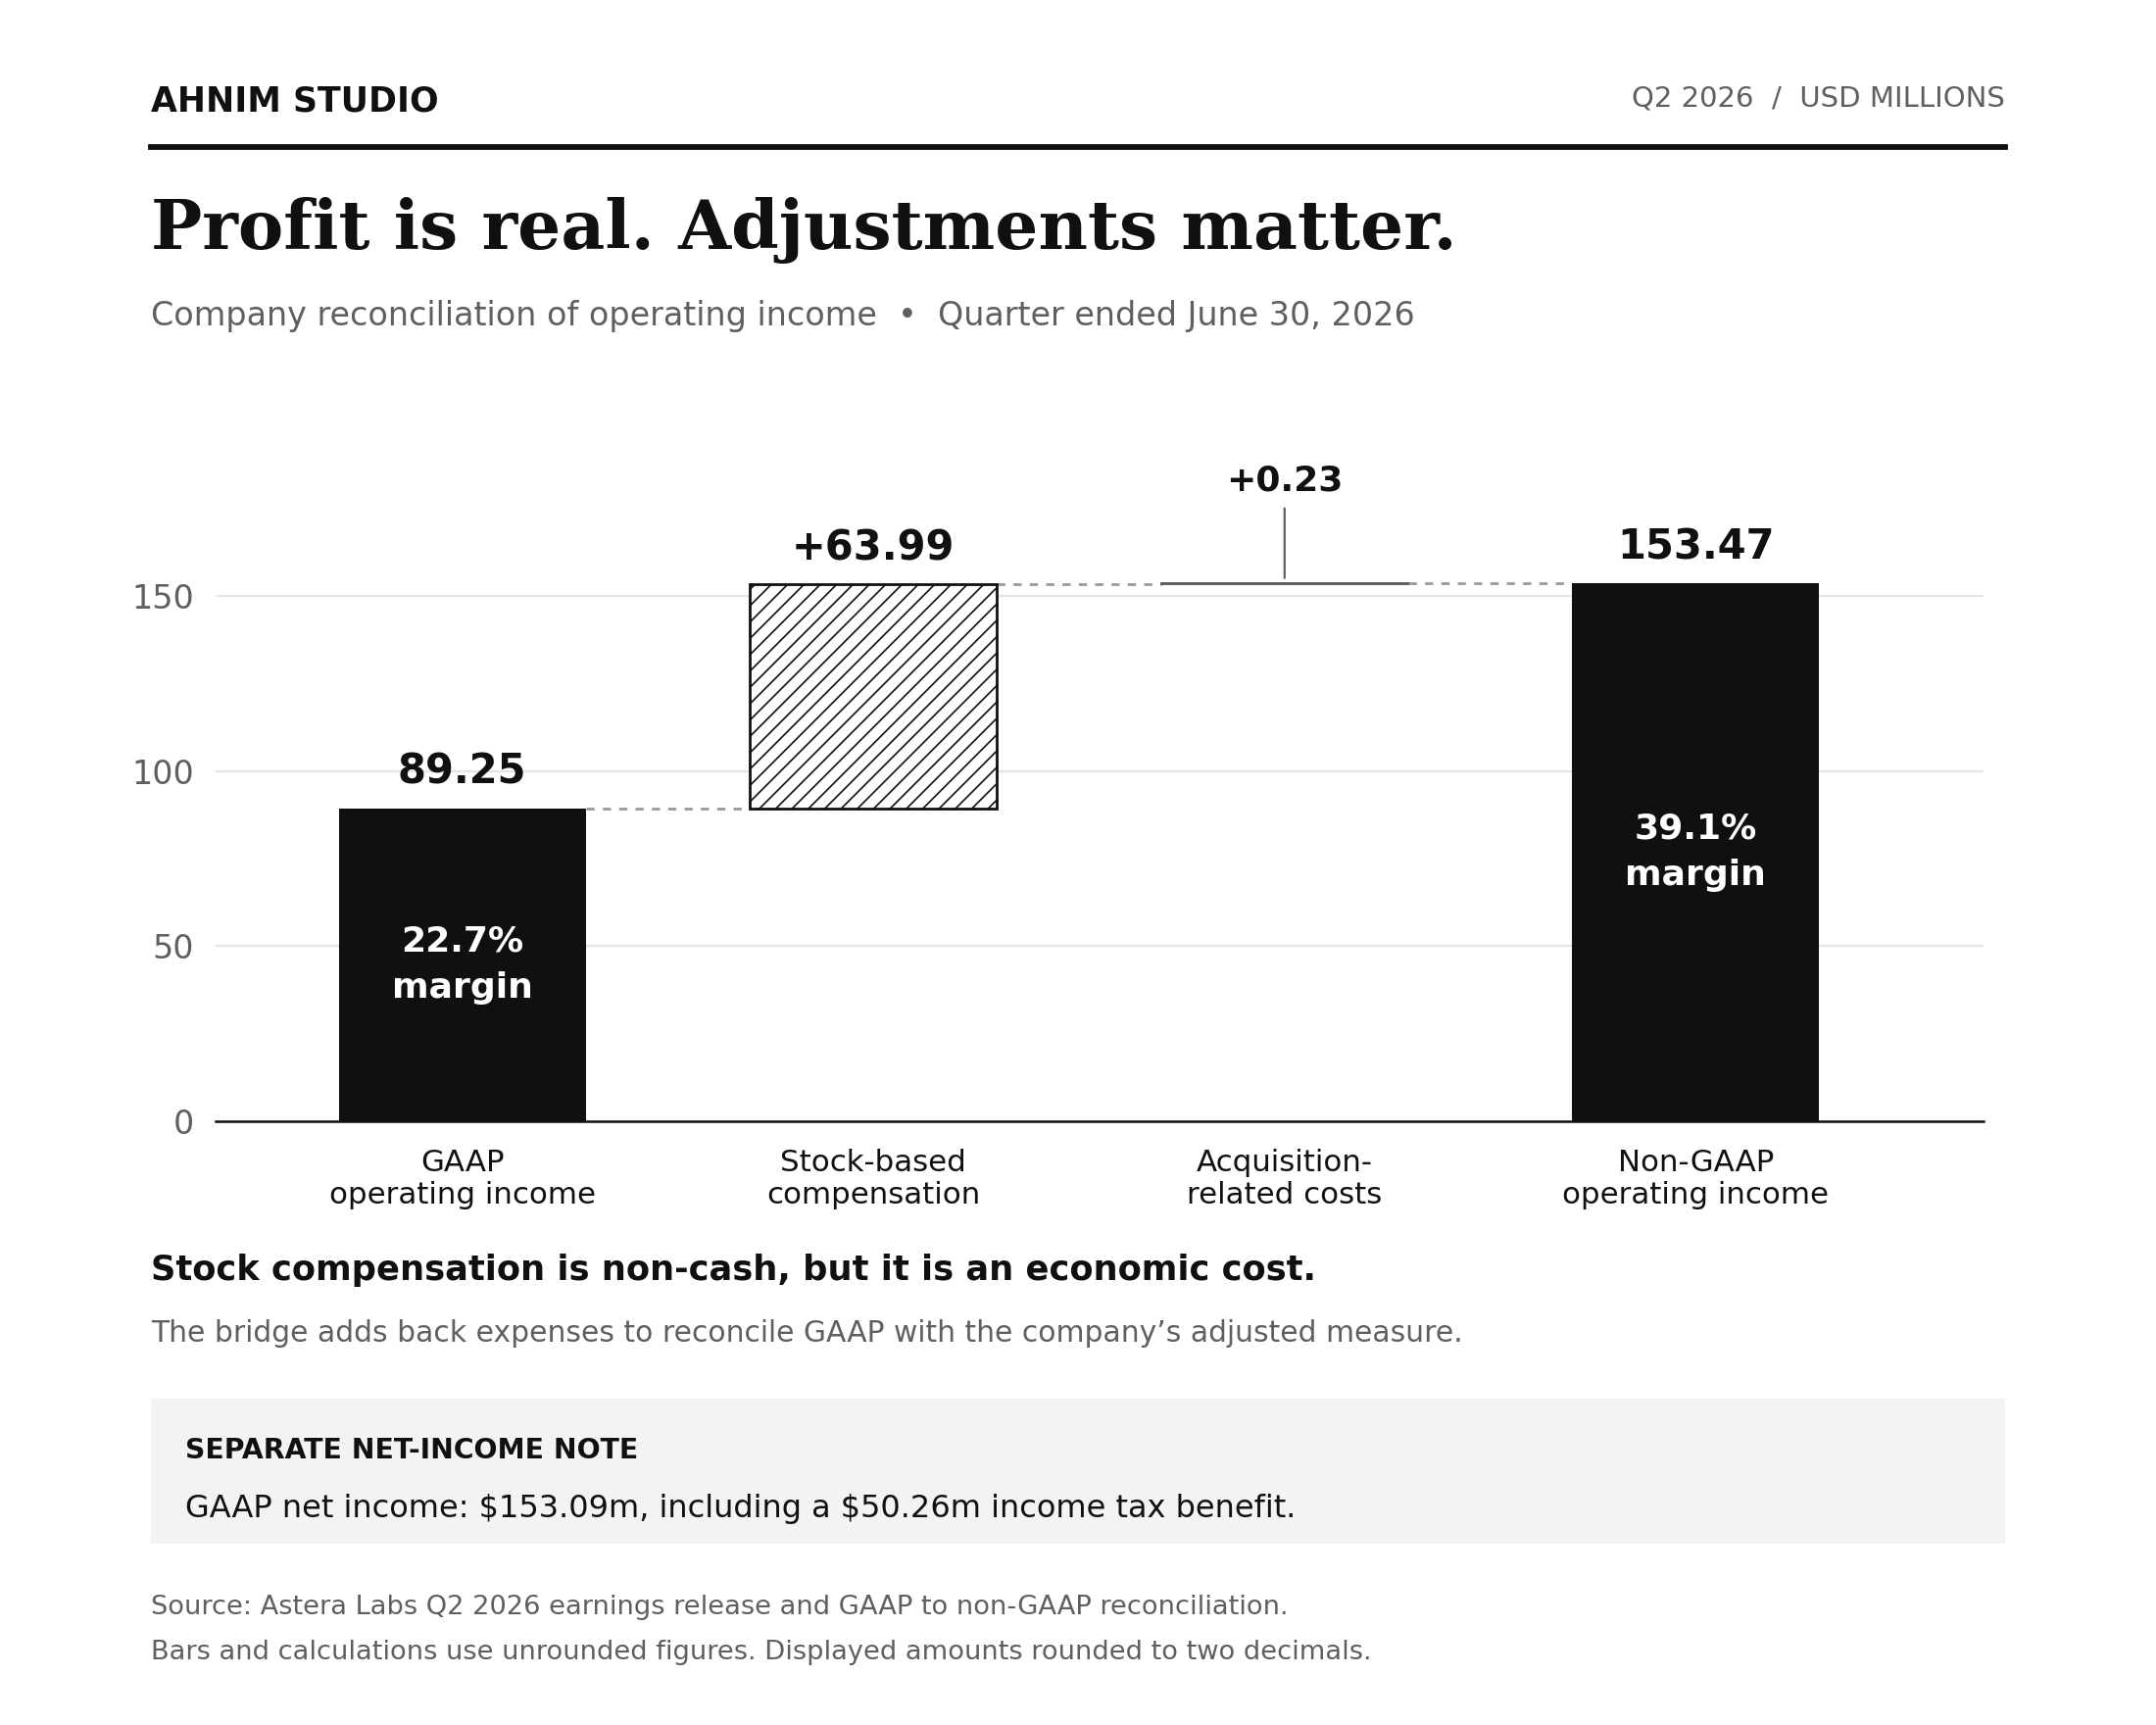
We therefore recognize both demonstrated profitability and the distinction between adjusted earnings and value retained by shareholders. Stock compensation is noncash at issuance but dilutes ownership. Strong revenue growth also need not preserve gross margins when modules, customer incentives and pricing change the mix.
Growth opportunities and unresolved risks
The October 8 Aries 7 announcement extends the signal-conditioning portfolio across copper and optical connections. Sampling is expected to begin in Q4 2026; broad availability depends on qualification. The expanded Leo memory-controller family was sampling in September. Neither announcement supplies enough customer volumes or pricing to assign a verified revenue contribution. [Aries 7] [Leo]
d-Matrix named Astera as a custom-connectivity partner for its Raptor program. Initial integrated MGX availability was expected in Q4 2027. That creates an opportunity for later revenue, but the announcement gives no Astera contract value. NVIDIA supplies the named NVLink switches; we do not assign those switch sales to Astera. [d-Matrix]
AWS and NVIDIA’s August 26 expansion of their Trainium/NVLink Fusion collaboration toward NVHBM adds architectural uncertainty as well as opportunity. It establishes neither an Astera supply award nor its displacement. We will change expected content only when the supplier’s role is supported by evidence. [AWS/NVIDIA]
Customer concentration is the largest business risk. In 2025, one end customer represented more than 70% of revenue and the top three approximately 86%. Master agreements generally lack minimum purchase commitments, and design wins do not guarantee volume sales. TSMC was the sole qualified IC manufacturer. [2025 10-K] Changes in direct manufacturing-partner billing shares do not, by themselves, prove end-customer diversification. [Q2 10-Q]
Independent operating scenarios
Our revenue model starts from $550 million, the Q3 guidance midpoint, multiplied by four. This $2.2 billion reference is an annualized run rate, not reported annual revenue. We separately model relevant customer-platform volume, net content per platform and relative supplier capture. Disclosed unit counts and selling prices are insufficient for a reliable product-by-product unit forecast, so these are explicit research assumptions.
Core revenue = previous core revenue × platform-volume factor × net-content factor × relative-capture factor. Total revenue adds a separate new-program cohort once. Relative capture is a multiplier, not absolute market share. Existing Scorpio ramps and replacement Aries products already included in the core are not counted again as new programs.
| AHNIM forecast | Bear | Base | Bull |
|---|---|---|---|
| 2027 revenue, $bn | 2.583 | 2.965 | 3.475 |
| 2028 revenue, $bn | 2.929 | 3.913 | 5.475 |
| 2029 revenue, $bn | 3.315 | 5.058 | 7.945 |
| 2028 / 2029 revenue growth | +13.4% / +13.2% | +32.0% / +29.3% | +57.6% / +45.1% |
| 2027 / 2028 / 2029 EPS proxy | $4.46 / $4.43 / $4.47 | $5.62 / $7.09 / $8.64 | $6.66 / $10.01 / $13.81 |
| 2027 / 2028 / 2029 inputs | Bear | Base | Bull |
|---|---|---|---|
| Platform-volume growth | 20% / 15% / 12% | 25% / 25% / 20% | 40% / 35% / 25% |
| Net-content growth | 3% / 2% / 2% | 10% / 5% / 5% | 12% / 10% / 8% |
| Relative-capture multiplier | 0.95 / 0.95 / 0.97 | 0.98 / 0.98 / 0.98 | 1 / 1.02 / 1.02 |
| New-program annual revenue, $m | 0 / 50 / 125 | 0 / 100 / 350 | 25 / 250 / 750 |
The driver table gives 2027, 2028 and 2029 assumptions in that order. New-program dollars are annual revenue for opportunities outside the starting cohort, not cumulative additions, backlog or assigned d-Matrix contract values. Product launches can span both cohorts; each modeled revenue dollar belongs to only one.
Bear: relevant platform demand continues to expand, but slower qualifications, weaker supplier capture and mix pressure limit growth. Engineering spending continues. This is a viable, growing business with weak per-share earnings progress, rather than a collapse of AI demand.
Base: existing products expand with customer deployments; richer content offsets some competition; selected new programs enter production. We retain modest annual capture erosion and do not assume all announced opportunities succeed. Our 2027 revenue of $2.9645 billion is close to the published $2.97 billion consensus, although our earnings adjustments differ. [Consensus]
Bull: multiple platforms scale successfully, higher-value connections expand and new memory/custom programs become material. The additional valuation premium also requires greater confidence in growth beyond 2028 and broader customers. Faster forecast sales alone are not sufficient to justify both higher earnings and an unrestricted multiple.
Profit and dilution bridge
| 2028 model input / output | Bear | Base | Bull |
|---|---|---|---|
| Reported-net revenue, $m | 2,928.63 | 3,913.09 | 5,475.11 |
| Gross margin excluding SBC | 70% | 73% | 74% |
| Operating expenses excluding SBC, $m | 1,000 | 1,150 | 1,600 |
| Finite existing-warrant adjustment, $m | 45 | 45 | 45 |
| Normalized tax rate | 18% | 18% | 18% |
| After-tax operating earnings proxy, $m | 897.94 | 1,436.27 | 2,047.20 |
| Gross potential economic claims, m | 202.511474 | 202.511474 | 204.511474 |
All future budgets above are AHNIM assumptions. Our earnings proxy is [(reported-net revenue × gross margin excluding stock compensation) − operating expenses excluding stock compensation + finite existing-warrant adjustment] × (1 − tax) ÷ economic claims. Operating expenses include ordinary depreciation; interest income is omitted. The 18% normalized tax rate is our forecast, not Q3’s guided tax rate.
Base calculation, $m: [(3,913.088125 × 73% − 1,150 + 45) × 82%] ÷ 202.511474 = $7.092312 per claim; × 50 = $354.62. Dividing the unrounded target by 1.13 gives $313.82. The equivalent Bear calculation is [(2,928.633494 × 70% − 1,000 + 45) × 82%] ÷ 202.511474 × 30 = $133.02.
The model starts with 190.311474 million gross potential claims: 173.485 million common shares, 9.180 million RSUs, 0.375 million PSUs, 1.693 million options and 5.578474 million customer warrants from the June disclosures. We assume 2.2 million additional H2 2026 claims, followed by 5 million new annual claims in Bear/Base and 6 million in Bull. Existing vested shares are not added twice. [Q2 capital disclosures]
For 2028, this gives 190.311474 + 2.2 + 2 × 5 = 202.511474 million claims in Bear/Base and 204.511474 million in Bull. We do not assume lower dilution simply because growth is weaker. These are gross economic claims, not GAAP diluted weighted-average shares: full assumed vesting and no option/warrant exercise proceeds are conservative simplifications, while a fixed grant count could understate dilution after a sharp share-price fall.
The $45 million 2028 warrant adjustment is an estimated finite noncash revenue adjustment on already-counted warrants, not additional customer sales. The earnings proxy excludes recurring stock compensation while the denominator includes projected awards through 2028. It is useful for comparing adjusted-earnings pricing, but it is not GAAP EPS or a complete perpetual measure of compensation cost. The separate DCF charges future compensation after its explicit dilution horizon.
The P/E method produces an equity price directly. We do not separately add forecast cash or subtract corporate bonds held as investments as though they were debt. This avoids mixing an enterprise-value bridge with an equity earnings multiple.
Multiple selection
Bear: 30× 2028 earnings. This is our judgment for continued revenue growth with roughly flat earnings, retaining some recovery and product optionality. It is below the Base premium, but is not a proven semiconductor-sector norm. A 25–35× sensitivity makes the uncertainty visible.
Base: 50× 2028 earnings. Needham’s August 5 public report used approximately 50× its 2028 non-GAAP EPS estimate of $8.50 to reach $425. We use that documented method as a provisional market-pricing reference, then apply our independent $7.09 earnings proxy. Differences in taxes, interest and share conventions mean the two earnings measures are not accounting-identical. [Needham methodology]
Bull: 55× 2028 earnings. We allow a 10% premium to the Base multiple only if successful programs support more durable growth and customer diversification. Our Bull forecast already contains faster expansion, so we limit the additional rerating. A 60× result near $601 is an upside sensitivity, not the principal Bull target.
| Fixed operating case | P/E sensitivity | Twelve-month price sensitivity |
|---|---|---|
| Bear | 25× / 30× / 35× | $110.85 / $133.02 / $155.19 |
| Base | 40× / 50× / 60× | $283.69 / $354.62 / $425.54 |
| Bull | 45× / 55× / 65× | $450.46 / $550.56 / $650.66 |
With Base earnings unchanged, 40× gives $283.69 and 60× gives $425.54. At the selected 50×, changing the tax assumption from 18% to 25% gives $324.34; doubling modeled new claims from H2 2026 through 2028 gives $334.47. These are isolated sensitivities, not additional targets.
These are judgmental pricing assumptions, not statistically estimated fair multiples. “Neutral” means consistent assumptions, balanced evidence and explicit uncertainty; it does not mean taking the midpoint of every broker target or assigning equal probabilities to the cases.
Broker comparison
| Action date | Broker / public report | Rating | Target |
|---|---|---|---|
| 2026-10-09 | Northland Securities | Market Perform | None |
| 2026-09-30 | Fubon | Buy | $500.00 |
| 2026-08-05 | Morgan Stanley | Overweight | $382.00 |
| 2026-08-05 | RBC Capital | Outperform | $500.00 |
| 2026-08-05 | UBS | Neutral | $425.00 |
| 2026-08-05 | JPMorgan | Overweight | $465.00 |
| 2026-08-05 | TD Cowen | Hold | $375.00 |
| 2026-08-05 | Evercore ISI | Outperform | $452.00 |
| 2026-08-05 | Needham | Buy | $425.00 |
Dates identify the latest selected actions we located by October 11, not an exhaustive coverage census. These are generally broker price targets over approximately a year from each report, so their end dates are not identical to ours. Public reports establish the targets, but most full valuation bridges were unavailable. We use Needham’s publicly attributed formula; we do not present unverified secondary JPMorgan or Morgan Stanley formulas as confirmed inputs.
RBC’s April 21 report provides a historical premium precedent: 74× 2027 EPS of $3.37, supported by expected product growth, high margins and sector rerating. That $250 target was superseded; we do not assume the later $500 target uses the same multiple. [RBC historical method]
S&P Global’s October 9 display showed 26 analysts, a $391.77 average and $425 median. MarketBeat showed $348.33 across 21 analysts, with a different coverage and update window. Our unrounded Base target is 9.5% below the former average and 16.6% below Needham. We do not average providers’ averages or treat the lowest broker’s central target as a complete downside stress test. [S&P Global feed] [MarketBeat methodology]
Growth-failure stress and cash-flow cross-check
A separate severe case retains our earlier assumptions: 2028 revenue of $1.971 billion, a $2.598 earnings proxy and a 20× multiple. It gives approximately $52 as a twelve-month stress price, or $46 as its 13%-return entry equivalent. It assumes sustained growth disappointment and premium compression together. It is neither ordinary Bear nor a liquidation floor; stronger customer losses or dilution could be worse.
| Separate DCF reference | Growth-failure path | Base path | Bull path |
|---|---|---|---|
| Current equivalent, constant 13% | $13.64 | $64.59 | $132.11 |
| Current equivalent, conditional lower mature operating risk | Unchanged | $71.29–$86.20 | $148.21–$184.09 |
The DCF figures above are current equivalents of conditional end-2030 business values. Their former stalled-growth case is now explicitly labeled a growth-failure reference; it is not a DCF of the new ordinary Bear. We did not silently change its revenue path. Base/Bull DCF assumptions retain 3% terminal growth, 28%/33% mature economic operating margins, 25%/30% terminal ROIC and compensation costs beyond the explicit share horizon. Terminal value represents about 64–66% of enterprise value.
The large gap remains unresolved. Market P/E targets embed more persistent willingness to pay for growth than our cautious cash-flow assumptions support. We cannot claim that DCF independently validates the $355 or $551 targets. Nor does one conservative DCF prove a ceiling on trading prices. We use the disagreement to limit conviction and expose growth-duration, capital-cost and compensation risk, rather than average incompatible outputs into a reassuring number.
Review changes
| Pre-publication review item | Earlier treatment | Final treatment and reason |
|---|---|---|
| Downside definition | Stalled growth and 20×: $51.96 | Retained as separate stress. Added ordinary Bear: continued growth, margin pressure and 30×: $133.02. |
| 2028 downside operating path | $1,970.99m sales; 68% gross margin; $750m OpEx | Ordinary Bear: $2,928.63m sales; 70% gross margin; $1,000m OpEx. Both paths remain documented. |
| Downside annual new claims | 4m in old stalled case | 5m in ordinary Bear, same as Base; weaker growth does not assure less compensation dilution. |
| Base / Bull operating forecasts | 2028 EPS proxies $7.0923 / $10.0102 | Unchanged; selected forward multiples 50× / 55×. |
| Timing | Current pricing sensitivities and separate end-2030 DCF | Explicit October 2027 targets using 2028 earnings, with separate one-year 13% entry references. |
This is a methodology and scenario-definition review dated October 11, rather than a response to a newly reported earnings result. The former $52 calculation has not been deleted or raised by changing its multiple. A separate ordinary downside operating path has been added. Base and Bull operating forecasts remain unchanged; future revisions will identify the old input, new input, source and price effect.
Evidence that changes our view
| Evidence | Model response |
|---|---|
| Reported production revenue and customer shipments | Revise platform volume and capture; replace guidance with actuals. |
| New customers and longer production visibility | Reassess growth duration and multiple only after evidence of improved durability. |
| Qualifications delayed or architecture/content lost | Reduce or postpone revenue, and reassess margin and premium together. |
| Mix, pricing, R&D and incentives | Revise gross margin, OpEx and finite warrant treatment. |
| Awards, financing or acquisition terms | Update claims and related earnings/cash; do not change shares in isolation. |
Q3 results and Q4 guidance will replace the current guidance-based starting point. A product announcement without revenue, timing or economic detail will update the investment thesis and monitoring list, with no automatic target increase. A deterioration in margins or claims can offset stronger revenue. Each update will distinguish reported facts, management guidance and our estimates.
Investment assessment
Our Base target of $354.62 implies approximately 3.6% appreciation from $342.21 over a year, below our assumed 13% hurdle. Achieving that hurdle from the reference price requires approximately $386.70 after one year with no distributions. The Base conditional entry reference is $313.82; it still depends on the forecast and the 50× premium being realized.
We remain constructive on the business and selective on valuation. The ordinary Bear shows that revenue can keep growing while shareholders lose money through weak per-share earnings and multiple compression. The Bull shows material upside if broader adoption produces both earnings and durability. Neither outcome should be treated as inevitable, and the width of the range is evidence of uncertainty rather than precision.
Investment information: AHNIM STUDIO is a research team providing investment analysis for information and education. This article is not personalized investment advice or an offer to buy or sell securities. Estimates may be wrong; returns and principal are not guaranteed, and substantial or total loss is possible. Readers should independently verify original filings, current prices, assumptions and risks before investing and make their own decisions. To the extent permitted by applicable law, AHNIM STUDIO accepts no liability for losses arising from reliance on this material; this does not exclude obligations that cannot lawfully be excluded.
Sources and original links
Accessed October 11, 2026. Company sources establish reported facts and stated plans; broker news is secondary reporting; AHNIM owns all scenario budgets, selected multiples and calculations.
https://stockanalysis.com/stocks/alab/forecast/
https://www.sec.gov/Archives/edgar/data/1736297/000173629726000010/alab-20251231.htm
https://www.d-matrix.ai/announcements/d-matrix-rackscale-nvidia/
https://www.sec.gov/Archives/edgar/data/1736297/000173629726000035/alab-20260630.htm
https://www.tipranks.com/news/the-fly/astera-labs-initiated-with-buy-at-fubon-thefly-news
https://www.marketbeat.com/stocks/NASDAQ/ALAB/forecast/
https://stockanalysis.com/stocks/alab/ratings/
https://pages.stern.nyu.edu/~adamodar/pdfiles/eqnotes/dcfstabl.pdf
https://pages.stern.nyu.edu/~adamodar/New_Home_Page/home.htm


Leave a Reply